
There is a difference between Earned Value (EV) and Earned Value Management Systems (EVMS). Earned Value is a performance metric that can be used to manage any project.
It provides meaningful comparison between planned and completed work and helps to answer the key project control questions:
- How much have we completed so far?
- Are we on schedule?
- Are we within budget?
Or, simply, how well are we doing? By enabling you to answer these questions, EV and EVM become powerful project management tools.
Earned Value Management (EVM) and Earned Value Management systems (EVMS) are management and control criteria and systems that use Earned Value as a key performance metric.
Many companies find EVM methodologies and, in particular, all the criteria defined in the ANSI EIA-748 standard to be an administrative burden. However, it is possible to implement EVM and reap the benefits of the EV metric and its derived indicators without taking on the rigorous cost of the extreme EIA-748 implementation.
In Practice
Earned Value is an objective and reliable productivity measure. It is reliable for both progress so far and prediction as to when the project is going to finish, and how much it is going to cost. EV also lets you compare performance across any project of any size. The three pillars for EVM are: scope, budget over time and progress data.
From the schedule, you can determine the Planned Value (PV) – the work scheduled to be completed by a specific date - and compare it to Earned Value (EV), the budget for the amount of work completed.
If the Earned Value is less than the Planned Value, you are behind schedule, and if the Earned Value is greater than the Planned Value, you are ahead of schedule. The Earned Value can be compared to the Actual Cost (AC) to determine whether you are above or below budget.
An Example from Capital Project Management
We present an example here of a situation which can be better understood through the application of EVM techniques.
As part of a larger capital development project, a civilian airport is facilitating the construction of a new shuttlebus maintenance facility, and the following plan has been laid out:
- The facility will be built in 12 stages
- Each stage will have a planned duration of 3 months, and an investment budget of $1,250,000
- This will lead to a total cost of $15,000,000, completed over 3 years
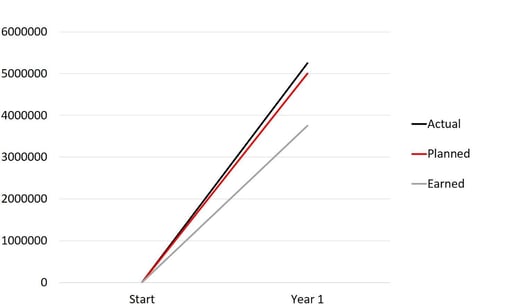
However, after the first year, only 3 stages have been completed, instead of the intended 4. The total cost at the end of the first year of construction is $5,250,000.

EVM Application
We can apply an EVM calculation to this situation, and find the following figures:
Actual Cost (AC) = $5,250,000
Planned Value (PV) = $5,000,000
Earned Value (EV) = $3,750,000
Where AC is the real cost to date, and PV represents the cost estimated to have been spent by now, on 4 stages of the project instead of 3. The EV is the expected cost of completing 3 stages of the project. It is clear that we are underperforming and over-spending.
Now it is possible to calculate several key metrics for assessing the health of the project and the performance to date.
Here, the disparity between the AC, PV and EV is clear. We can use these 3 values to calculate variance measurements and performance indices.
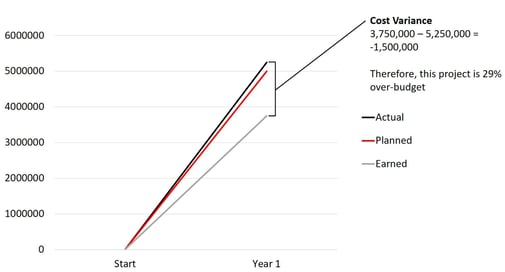
The Cost Variance (CV) (simply the EV – AC) in this example amounts to $1,500,000, which can also be expressed as a 29% overrun.
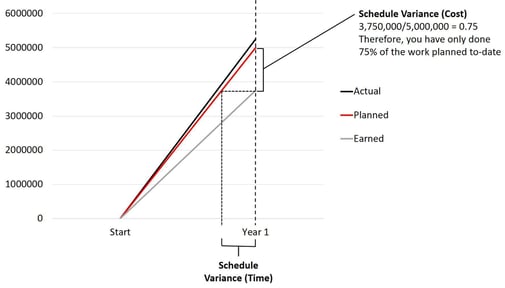
The Schedule Variance (SV) (simply the EV-PV):
= $3,750,000 - $5,000,000 = - $1,250,000.
Stages 1-3 are done, but you planned on getting 1-4 done. The schedule variance can also be expressed as stating that you are 25% behind schedule.
Indices
Indices are used to measure performance on a ratio. If you work perfectly to your plan, your index will be 1.0. Above 1.0, means you are doing better than planned, below 1.0 means you are doing worse than planned.
- Cost Performance Index (CPI): EV/AC, using the numbers above, the CPI
= 3,750,000/5,250,000= 0.71
- Schedule Performance Index (SPI): EV/PV
= 3,750,000/5,000,000= 0.75
The schedule performance index (SPI) is defined as the Earned Value divided by the Planned Value and is useful for identifying schedule problems, especially when used with critical path information. The CPI and SPI indices can be used to compare performance across projects regardless of their size.
Long-term projections
Earned Value metrics and indices have proven to be a reliable and sound basis for forecasting. Forecasts can be built using the CPI to create an estimate at completion (EAC) which can be compared to the Budget at Complete (BAC) to create at complete variances in real numbers and as a percentage.
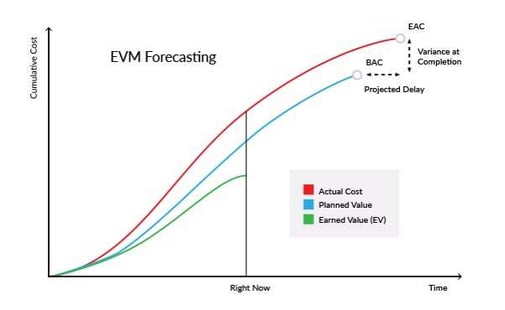
- Using the values above the Estimate at Complete (EAC) = AC + (BAC-EV)/CPI
= $5,250,000 + ($15,000,000 - $3,750,000)/0.71 = $21,095,070
- The Variance at Complete (VAC), or the predicted overrun = EAC-BAC
= $21,095,070 - $15,000,000 = $6,095,070
We can also calculate what effort will be required to get the project back on schedule.
To finish the project to budget:
Performance required to complete is expressed using the To Complete Performance Index (TCPI)
= remaining work/ remaining funds ((BAC-EV)/ (BAC-AC))
= ($15,000,000 – $3,750,000)/ ($15,000,000 – $5,250,000) = 1.153
Work would have to be completed at 115.3% the rate originally planned. Compared to the to-date Performance index of 0.71 you may conclude with that this is not likely to happen. Studies on CPI has shown performance tends to stabilise within 10% by the 20 perecent completion point.
Trending
As demonstrated above, cumulative performance indices are useful for predictions and forecasting. Performing EV analyses and Index calculations at timely and regular intervals, such as weekly or monthly, are useful for EVM metric trending. How does our performance vary and what effect does it have on variance calculations and analysis?
Periodic recording and trending allows you to direct attention to the deviations that require attention and ignore minor fluctuations, as well as treating them as early warnings.
An Invaluable Tool
Our example shows how EVM metrics can give insight into valuable information and be used as early warning signals on project health. Reported at regular and timely intervals it allows project managers to make better decisions and take corrective actions early in the project.
Safran Project incorporates a number of project management techniques, including EVM, to help manage large capital projects. For more information on our project scheduling tool, click the link below.
