
Learning Assets
In part one, I compared the technology that underpins OPRA with that utilized by Safran Risk. More specifically, I explained that the technology’s inability to support large risk models is the most common criticism levelled at OPRA. However, taking second spot on that list would be the clunky nature of the program’s user interface.
When Pertmaster (OPRA) was re-introduced as a Risk Analysis tool in 2001 — Pertmaster having been a critical path method (CPM) scheduling tool up until that time — it boasted a pretty decent user interface.
It looked like a typical CPM scheduling tool for the most part. The only exception being that it featured an extra “Risk” menu under which inputs were available, while extra items for outputs were included under the “Reports” menu.
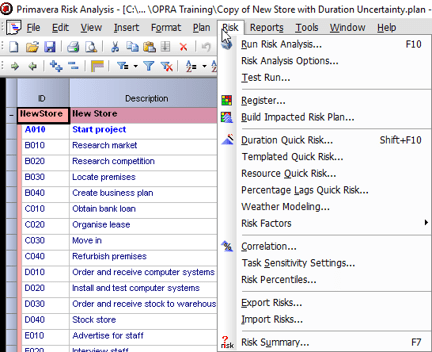
OPRA Risk Menu
For most risk users of the time, this UI was more than sufficient because Schedule Risk Analysis (SRA) was still a relatively new and immature concept.
Performed infrequently and by relatively few people, users would gradually learn where to find the required items in the Risk and Reports menus over time. The guiding principle was, essentially, if someone could master P3 or Artemis, Pertmaster should be a walk in the park! Besides, compared to Primavera’s Monte Carlo add-on, Pertmaster offered a significant step forward in terms of usability.
Fast forward to 2020 and these deficiencies have grown into a serious pain point for project managers; especially when it comes to moving reports and layouts from one model to another in order to generate consistent outputs. Suffice it to say, the process has become nothing short of tedious.
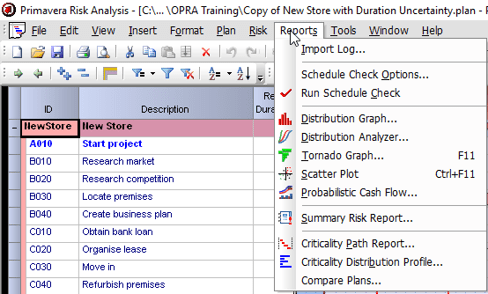
OPRA Reports menu
After nearly 20 years of schedule risk analysis, things have changed considerably. We now have defined risk maturity models, while organizations have made SRA part of their project management methodology and project teams routinely build their own risk models. The number of people requiring access to these systems and, more importantly, the knowledge and technical know-how to operate them effectively has grown. It’s therefore imperative that modern risk management tools employ a logical workflow.
When Safran developed Safran Risk, they pulled on the experience of the original Pertmaster developers to modernize the User Interface and make it easier for project managers to understand and learn.
The first step was to change from a menu-based input model, to a sequential, tab-based workflow system. This enables users to navigate from left to right as they build the risk model, delivering a more natural and intuitive process.
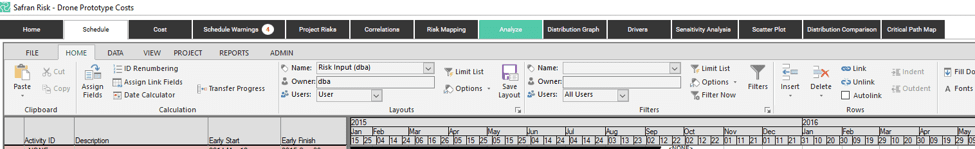
Safran Risk tab-based navigation
Additionally, all the functionality of Safran’s scheduling tool is available in the same application — itself one of the main advantages of building the risk engine on top of the scheduling package. Users can create layouts and filters, and share them between users and projects, simplifying the application of standard processes and reports.
The importance of streamlined, more ergonomic UI shouldn’t be underestimated. Not only does it streamline the process of training new users, it decreases the likelihood they’ll miss key steps when navigating a custom risk model or designing a brand-new one from scratch. Speaking for myself, I find the Safran UI makes everything a lot easier.
I still come across the occasional individual for whom the P3 interface was markedly superior to Primavera. Nevertheless, I doubt any of them would want to go back to working with P3 on a daily basis. It’s the equivalent of owning a classic sports car: you might like the idea of having a Triumph TR6 in your garage, but you wouldn’t want to drive one to work in the middle of the Canadian winter!
Join me for my next blog post where I’ll be discussing the benefits of integrated cost and schedule risk analysis.
Many years ago, I was hired by a large multinational oil and gas company. They were about to embark on a new technology project and my role was to conduct a schedule risk analysis in preparation for a go/no-go decision from the board. At the same time, another consultant was tasked with performing a cost risk analysis.
Billions of dollars were at stake, yet the organization in question wanted to review the results of our investigations independently. We were forbidden from discussing our findings with one another.
Nevertheless, having agreed that cost and schedule risk were intrinsically linked, we investigated ways the two analyses could be combined to provide greater insight. We narrowed down our list down to two options:
When faced with similar conundrums in the years since, the oil and gas industry has generally favored option two as the most feasible.
But what we and the industry as a whole needed was a system that would allow us to develop the two models concurrently so that the impact of uncertainties and risks related to both cost and schedule in the Monte Carlo simulations would be visible immediately.
A recent study of Oil and Gas megaprojects in Alberta found that, on average, 19% of projects experienced cost overruns, while 17% experienced schedule overruns.
It’s no coincidence that these numbers are so closely correlated. Yet we continue to make decisions on cost and schedule mitigation strategies without clear insight into the impact changes to one is likely to have on the other.
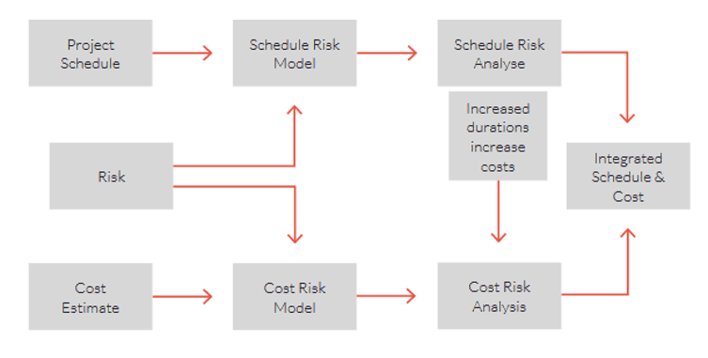
Figure 1: Integrated Cost and Schedule Risk Process
Often as project managers, we get tunnel vision. We focus too heavily on schedule or cost at the expense of the other. For example, I once worked on a turnaround project that had a budget of $120 million and a 35-day maintenance window. Management communicated that schedule was everything; cost was very much a secondary concern (so much so that it wasn’t even monitored during the project). In response, the project team started burning overtime almost from the first shift to maintain the schedule.
We completed the work on time to great fanfare. But, months later, when all the invoices were in, it was discovered that our success came at a price: $160 million, to be precise. To put it another way, we were $40 million over budget. This caused great distress within the organization. Heads rolled and the company hierarchy abandoned the “Full speed ahead, damn the torpedoes” approach from thereon in.
Schedule pressure dooms more megaprojects than any other single factor – E. W. Merrow
The ideal solution for project managers is a method that allows them to accurately gauge the likelihood of achieving both cost and schedule goals concurrently. This is known as the Joint Confidence Level (JCL) and it helps us to understand the interdependencies that link the two halves of successful project management.
The AACE 57R-09 Integrated Cost and Schedule Risk Analysis Guideline provides a detailed explanation of the process of combining cost and schedule risk analysis. As does Dr. David Hewlitt’s book Integrated Cost-Schedule Risk Analysis.
OK, so now we understand why we need to conduct cost and schedule risk together. But why choose Safran Risk specifically?
Safran Risk is one of the only tools on the market that provides users with the option of evaluating cost and schedule risks together. Costs can also be modelled separately or collectively with activity durations; it’s also possible to apportion part of an estimate line item to a schedule activity while leaving the rest independent. This provides greater flexibility when modeling extant risks on a project and helps project managers avoid the frustration of trying to resource load a traditional critical path method (CPM) schedule to match cost estimates.
In addition, Safran Risk simplifies what-if analysis. While cost vs schedule risk outcomes can be mapped on a scatter plot to create a Joint Confidence Level diagram illustrating the probabilities of hitting cost and schedule targets concurrently.
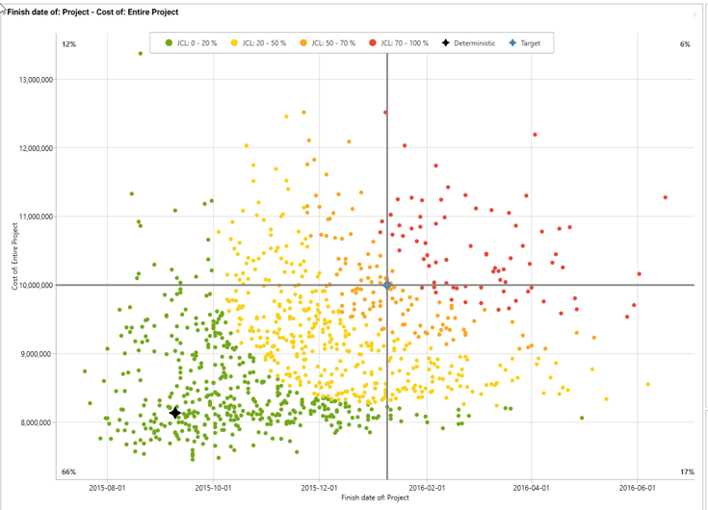
Figure 2: JCL at 70% confidence – note the deterministic cost and schedule probability (the star shape) is only 17%
With so much to offer, it should come as no surprise to learn that a recent evaluation of commercially available risk management tools boasting integrated cost/schedule risk analysis undertaken by the Energy Facility Contractors Group (EFCOG), chose Safran Risk as the best product for those working with Primavera P6, and the second best for those working with Microsoft Project.
Come back in a few days for part four of our series where I’ll be discussing the subject of analysis by exclusion. Specifically, how Safran's approach is considerably faster and more accurate than OPRA.
I first heard about analysis by exclusion a few years ago while I was helping a large mining company refine their risk processes. Curious, I asked for a demonstration of how it worked in OPRA.
In step one, the existing risk model was run through OPRA with all extant risks attached. Once completed, the team would then rerun the model multiple times, removing risks one at a time and comparing the outputs from each updated model with the initial analysis. The result was that the team were able to more accurately gauge the impact of individual risks on the wider project.
However, it quickly became apparent there were a few drawbacks.
The main issue was time.
To effectively answer the question “What is the impact of this specific risk on the schedule?” and generate usable data, OPRA users would have to:
Additionally, there were issues with quantifying the impact of each risk. Tornado charts ranked activities and risks automatically in OPRA, but they were also based on Pearson’s Product Moment. This meant they were categorized by percentage rankings: something project managers struggle to interpret.
All-in-all, I was informed it would take about a week to perform comprehensive risk analysis by exclusion on a large construction schedule using OPRA; more if the model was subjected to changes during the process.
One of the key tenets of workplace efficiency is that if a process must be repeated time and again, it should be automated.
For starters, this saves time that would otherwise be wasted performing mundane tasks. But it also improves accuracy — which is crucial for risk analysis by exclusion and the process more generally.
Imagine you forgot to turn Risk Factor #9 back on before switching off Risk Factor #10, the results of that iteration of your analysis would be skewed. The team might then act on the wrong Risk Factor, simply because its impact was incorrectly overstated.
This got me thinking about automating the process in OPRA using visual basic. I brought the question to my friend and colleague Russell Johnson — who also happened to be the former CTO of Pertmaster.
His response was interesting. While technically possible, he warned me several big obstacles stood in the way.
These days, the question of manual vs automated analysis by exclusion in OPRA is moot, seeing as Oracle dropped visual basic support years ago. Nevertheless, when developing Safran Risk, Russell Johnson remembered the difficulties experienced by OPRA users and so decided to automate the process.
The results speak for themselves.
Analysis that would have taken 40 hours to complete in OPRA takes mere minutes when conducted via Safran Risk. Moreover, it offers far greater accuracy, reducing the likelihood of mistakes to zero.
To understand how it does this, we need to take a closer look at how analysis by exclusion works in SR.
To begin, Safran Risk allows users to perform analysis in single or multiple passes.
During a single pass, SR runs through each risk once. It then displays an output with each risk individually excluded — essentially, it’s the same exercise my client was performing, only automated.
Below is a diagram displaying the results of a single pass analysis with all risks on a demo ‘Drone’ project included.
.png?width=708&height=452&name=OPRA-SR%20Upgrade%20Post%204%20-%20Single%20Pass%20Analysis%20(Diagram%201).png)
Compare that with the diagram below which shows the results when only one risk and opportunity have been removed.
.png?width=708&height=447&name=OPRA-SR%20Upgrade%20Post%204%20-%20Single%20Pass%20Analysis%20with%20Exclusion%20(Diagram%202).png)
In the examples given here, the black line represents all risks turned on (the “None” line) and the green line represents the same model with only the Testing Overrun risk turned off. This indicates that, at P70, we would save 33 days if we could eliminate the Testing Overrun risk.
However, the cumulative saving of removing multiple risks is not entirely clear in this example. We also have to bear in mind the fact that turning off one risk may mitigate another; particularly if they’re closely correlated. We could get around this by performing the task manually: turning off the top risk, running the analysis, running the next risk, etc. But this only serves to increase the workload.
To truly understand the interaction of the top risks, we must run the same analysis but using multiple passes.
In multiple pass mode, the system runs for a pre-determined number of iterations as specified by the user. With each new iteration, it removes the top risk; with the previous iteration’s risks turned off. This prevents large impact risks from overshadowing lower impact risks, while also displaying the cumulative impact mitigating each additional risk will have on the schedule.
So, in the example below, we turn off the top five risks cumulatively. Pass one turns off Testing Overrun; pass two both Testing Overrun and Design, and so on.
.png?width=708&height=444&name=OPRA-SR%20Upgrade%20Post%204%20-%20Multiple%20Pass%20Analysis%20(Diagram%203).png)
Again, look at the P70 values:
This information is invaluable, as it allows the project team to gauge the impact removing these risks would have on the project. But what about the costs of mitigation vs the cost of the risk itself?
In a previous blog, I wrote about the advantages of integrated cost and schedule risk analysis. Here, thanks to Safran Risk’s integrated model, I can review the same information as before, but on a cost basis.
The final diagram shows what our cost Analysis by Exclusion looks like for every risk: that is cost and schedule. Notice there are a few more risks shown in this display, since there are now cost risks that do not have a schedule impact included.
.png?width=708&height=347&name=OPRA-SR%20Upgrade%20Post%204%20-%20Multiple%20Pass%20Analysis%20with%20Exclusion%20(Diagram%204).png)
As you can see, it tells us that by removing the Design Specification risk and ensuring that the Outsource opportunity occurs, we can save 49 days and $295,000. At the same time, any costs associated with the mitigation strategies are also included in the model, ensuring you have direct access to all the information you need from a single dashboard.
Come back in a few days for part five in my series, where I’ll be investigating the features that make modelling risk events and uncertainties so much easier in Safran Risk.
Correlation is often crucial to the risk model. It helps analysts understand the often-complex relationships between events and the risks that can affect them. More than that, it plays an integral role in counteracting the effects of the Central Limit Theorem (CLT).
Put simply, in the realm of schedule risk analysis, correlation describes the mutual relationship between one or more events. It indicates the increase or decrease in probability of a particular risk event occurring should a related risk strike.
Think of it this way: if the first piling activity on an earthworks project suffers issues, correlation allows you to gauge the probable impact this will have on subsequent piling activities. Further, it helps you estimate the likelihood that excavation activities as a whole will be affected.
When viewed from that perspective, it’s easy to see why risk managers build correlation into their risk models. But of correlation has another purpose: to counteract the effects of the Central Limit Theorem.
There have been many articles written about CLT, but to summarize the main thrust of the theorem:
If you have several similar duration activities linked together in a series that possess the same uncertainties, should one randomly-sampled activity ‘go long’, another will ‘go short’ – they will effectively cancel each other out. This leads to a loss of extreme values in the probabilistic analysis.
That being the case, some argue that correlation is crucial when it comes to combatting the Central Limit Theorem and its impact on the model. While others claim that, so long as you operate on a high-level schedule, the CLT is a non-issue and thus correlation is not required.
We’ll leave the discussion of which level of schedule risk should be performed and when for another blog, but personally, I prefer working with the project team’s live schedule. These tend to clock in at level three or four, which makes correlation a vital component of the wider model.
Let’s take a look at the impact of the CLT on a one and ten activity schedule.
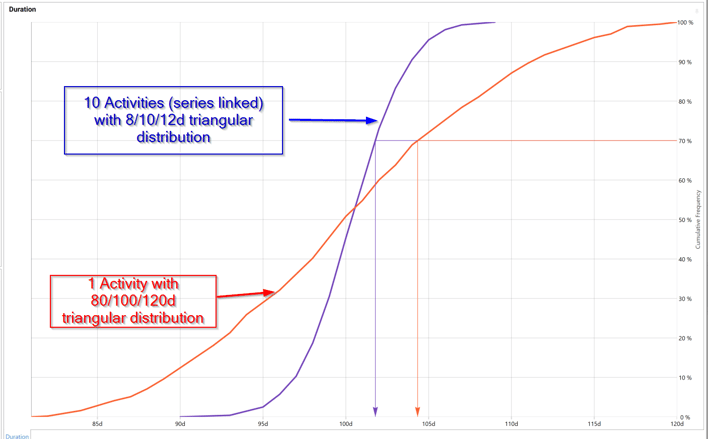
Figure 1: The effect of Central Limit Theorem on a ‘one and ten activity schedule’ with the same overall deterministic duration and uncertainty distribution. P0 duration is 80 days vs 90 days; P100 duration is 120 days vs 110 days.
As you can see, the CLT has cut ten days off each end of the distribution in the case of the ten-activity model. However, applying correlation can correct the impact of the CLT by preventing the cancellation that occurs in a purely random sampling.
Applying an 80% correlation between the risks leads to the following result:
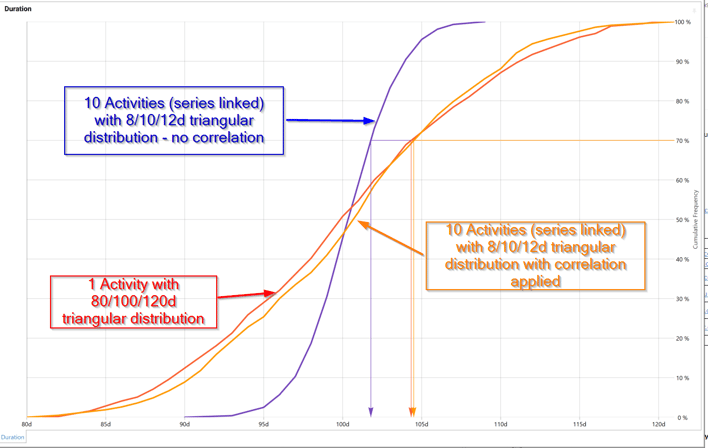
Figure 2: The effects of applying correlation to correct the Central Limit Theorem in our one and ten activity schedules.
By applying a correlation to the uncertainties on the ten-activity model specifically, we can closely approximate the one activity model. So, to reflect the risk’s interdependencies and combat the CLT on our model, we need to enter correlation.
But how do OPRA and Safran Risk compare when it comes to correlating risk?
In OPRA, correlation is assigned between activities. This means that to combat the central limit theorem for ten activities, you need to link each of them together in the tool’s correlation module. While this isn’t a particularly complex process, it can be time-consuming – and it only gets worse as additional activities are correlated.
What’s particularly confusing for the user is that they have to decide which activity is the ‘parent’ and which the ‘children’ in the correlation. Which activity takes precedence. Do you choose the first one in the string? The longest? Or something else? But because OPRA documents activities so poorly, it can be difficult to decide which makes the most sense.
Performing multiple correlations between activities, along with several uncertainties or risks, only adds to the complexity. Unless you have a PhD in statistics, chances are you won’t know what to correlate or by how much.
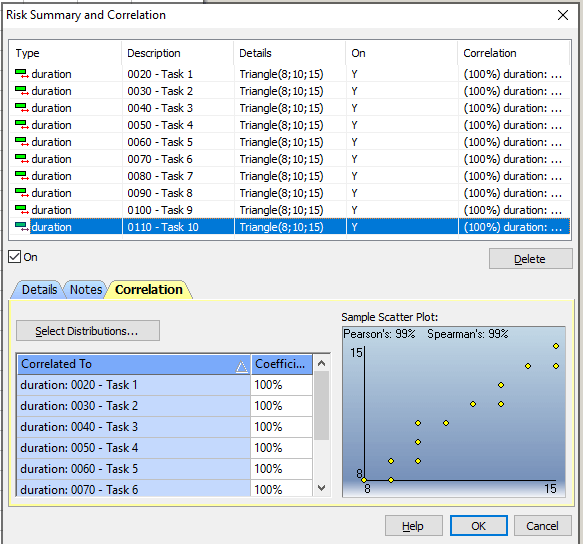
Figure 3: Correlation Assignment in OPRA
Safran Risk takes a different approach…
First and foremost, Safran Risk correlates the risks themselves, not the activities. This makes perfect sense in that, if you have an activity with multiple risks, the correlation applies exclusively to the risk in question and not the entire activity. Similarly, if a risk affects multiple activities, the correlation is applied automatically (although this can be turned off manually, if required).
The biggest advantage Safran Risk has over OPRA is that it offers several ways to handle correlation.
The first, single risk impact correlation, correlates the impact of a single risk on every activity to which it applies. As you can see in the diagram below, unchecking the box will apply 100% correlation to each activity the risk is assigned to:
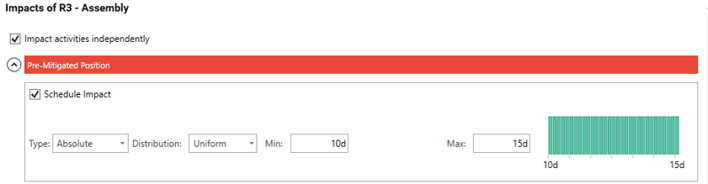
Figure 4: Safran single risk impact correlation
What if you need to correlate multiple risks? OPRA’s approach to activity correlation makes this almost impossible. By contrast, Safran Risk allows you to correlate risks simultaneously, automatically calculating the appropriate impacts. This is demonstrated in the Safran Risk correlation mapping matrix below:
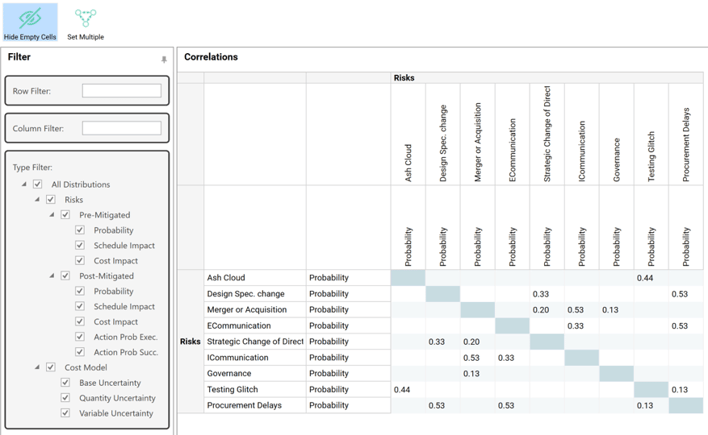
Figure 5: Safran Risk Correlation Mapping Matrix
Aside from giving you the tools to correlate risks to each other, it enables you to independently correlate the probability of each individual risk’s occurrence and its potential impact on the schedule. Further, the pre and post-mitigated positions can be differently correlated, along with cost risks (not shown above).
All things considered, understanding and applying correlation in Safran Risk is considerably easier.
As we’ve discovered over the course of this article, when incorporated into your risk model, correlation leads to better, more accurate results (not to mention less discussion of the Central Limit Theorem!) And, when correlation is clear and easy, you're more likely to apply it.
Check back in a few days’ time for part 7 in my series. Be sure to read my existing articles if you’re interested in learning more about the differences between OPRA and Safran Risk in the meantime.
Mitigation analysis is a massive part of the risk analysis process, and Safran Risk makes it easier and less time consuming to conduct. It’s a huge improvement over OPRA, and this blog will explore why.
I’m Ian Nicholson, VP Solutions at Emerald Associates. I’ve been working with Oracle Primavera Risk Analysis (OPRA) since 2001 when it was called Pertmaster. Emerald was the exclusive Canadian distributor for Pertmaster until their acquisition by Primavera in 2006.
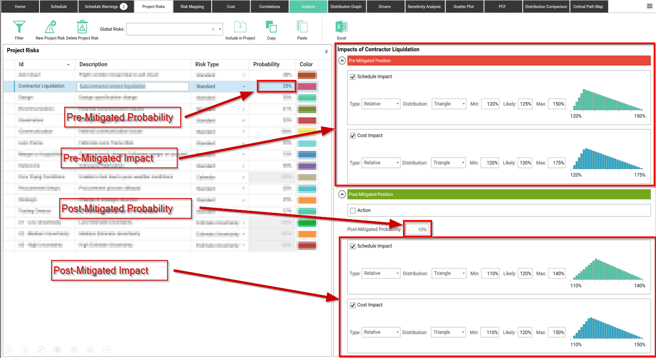
In part 5 of this series, I discussed entering risks and uncertainties in your risk model and then assigning them to the activities and costs that make up your risk model.
Once the model is built, and you’ve performed your risk analysis, your risk tool will tell you which risks are significantly impacting your model. The project team’s discussion should then turn to mitigation strategies.
You should be able to improve your chances of achieving your deterministic values for cost and schedule by focusing efforts on mitigating the risks at the top of the tornado.
Mitigation strategies may involve:
Why is the 4th item even in our list? Well, we have to be realistic in our mitigation strategies. Sometimes, the cost of implementing any of the first three options make them financially unrealistic, leaving us to accept the risk as is. This doesn’t mean our efforts to identify the risk were in vain, since “forewarned is forearmed” and we’ve raised the visibility of the risk within the project team.
Incidentally, we should not forget that we need to maximize opportunities as well as mitigate risks.
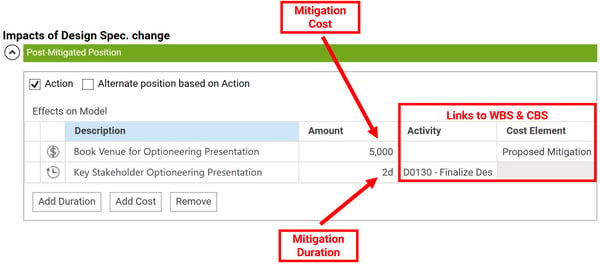
Let’s assume that you want to include one of the first three options in the risk model. In OPRA, this can be done painlessly for risks, but not for uncertainties. This is because uncertainties have to be entered directly on the activities, a laborious process that’s prone to errors.
Additionally, OPRA does some frankly annoying things when conducting pre or post-mitigated model analysis:
When working with OPRA and conducting a mitigation model analysis, it’s not unusual to be juggling 20 files with various pre and post mitigated what-if analyses. No matter how carefully you name them, you'll inevitably lose track of one or two and have to start on them from scratch. It can be a nightmare.
Safran Risk makes managing mitigation strategies much easier for the following reasons:
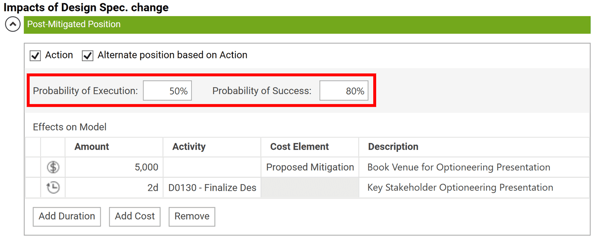
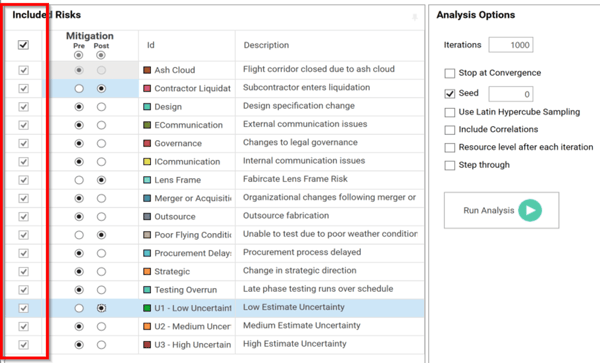
Mitigation analysis is a critical aspect of the risk analysis process, and Safran Risk makes performing this task painless and fast. There can be no doubt that, when it comes to mitigation analysis, Safran Risk is far more effective than OPRA.