Discover the benefits of moving from spreadsheets to risk management software
Monthly Risk Data Reporting Issues
Years ago, as a divisional risk manager responsible for reporting on over 30 aerospace projects, gathering the monthly data for reporting to management was one of the toughest parts of the job. Each project claimed it was doing fine with its spreadsheet risk register. However, the risk registers' data always started to creep away from a common standard. In part, this was driven by individual customer demands. But more often than not, it was driven by the project managers, who just loved to tweak the spreadsheet to make the risk register ‘work better’ for them and their team.
Aggregating Risk Data for Accuracy
Now, anyone who knows me, knows that I love a spreadsheet! I didn't get where I am today without knowing my VLookup from my pivot table! However, when it comes to aggregating the data from 30 unique spreadsheets, the only way to proceed was to laboriously open each one, locate the desired output, and manually copy it into my master workbook. This took hours and was prone to errors. Often the spreadsheet I was looking at was out of date, at other times I misinterpreted the meaning of the column and copied the wrong piece of data.
My biggest bugbear was the identification of the remaining contingency on each project. In those days, we would use the simple formula of contingency being equal to the sum of the factored risks. By factored risk, I mean the probability of the risk multiplied by its single-point impact. This worked well until some bright sparks went on a course and started using three-point estimation as favoured by the MoD back then. So now, I had some projects with single-point data and some with weighted average data. Trying to consolidate that to determine what my portfolio of projects looked like was suddenly much more complicated.

Having A Common Risk Register to Enable Success
My attempts to get everyone to use a common risk register were often thwarted by the pushback of, "But my customer requires such and such a format", or else it would be, "My team are used to doing it this way". I could never find the sweet spot where everyone could simply update their data and point me in the right direction to obtain what I needed.
Eventually, I convinced my organisation to move away from spreadsheets and adopt a risk database. This made my life easier as now I was able to interrogate a common source of information, created using a common standard. However, these early attempts to standardise risk data still suffered some difficulty. While I could now access the data for the individual projects, I still needed to export the data into a spreadsheet to aggregate the different projects in my area of responsibility.
What I really wanted, but was unable to find at the time, was a way for each project to manage its risk data in a simple interface using common methods. From there, I wanted to be able to easily select the projects I was interested in, be they clustered under one hierarchal organisation or distributed across many. With the selected projects, I wanted to generate different reports that could tell me everything I needed to know to report on Risk Management at the monthly divisional review.
Ability to Address Real-Life Risk Reporting Problems
What sort of reports? For instance, I wanted to know how many threats each project had open when compared to the amount of time left until the end of the project. I had observed a ‘bow wave’ of contingency which was being held back as projects neared completion. An understandable reaction as project managers feared that something could still go wrong as the end of the project approached. However, through analysis of the actual risks compared to the supposed risks against which the contingency was being held, it became clear that the Project Managers were playing it too safe. Armed with this new information, I convinced the Projects that releasing the excess contingency to margin, and reporting a healthy quarterly profit for the division, was better for the division as a whole. The upside of this for the Project Managers was that the declared division's profits significantly influenced their annual bonus. Good management of real risk resulted in happier Project Managers and also a happy me, as I received the bonus too! It was a win-win.
Eventually, the organisation moved away from calculating contingency based on individual risk values and adopted a more statistical approach to understanding the degree of confidence (also called its P-value) that a contingency budget held.
Safran Risk Manager - Better By Design
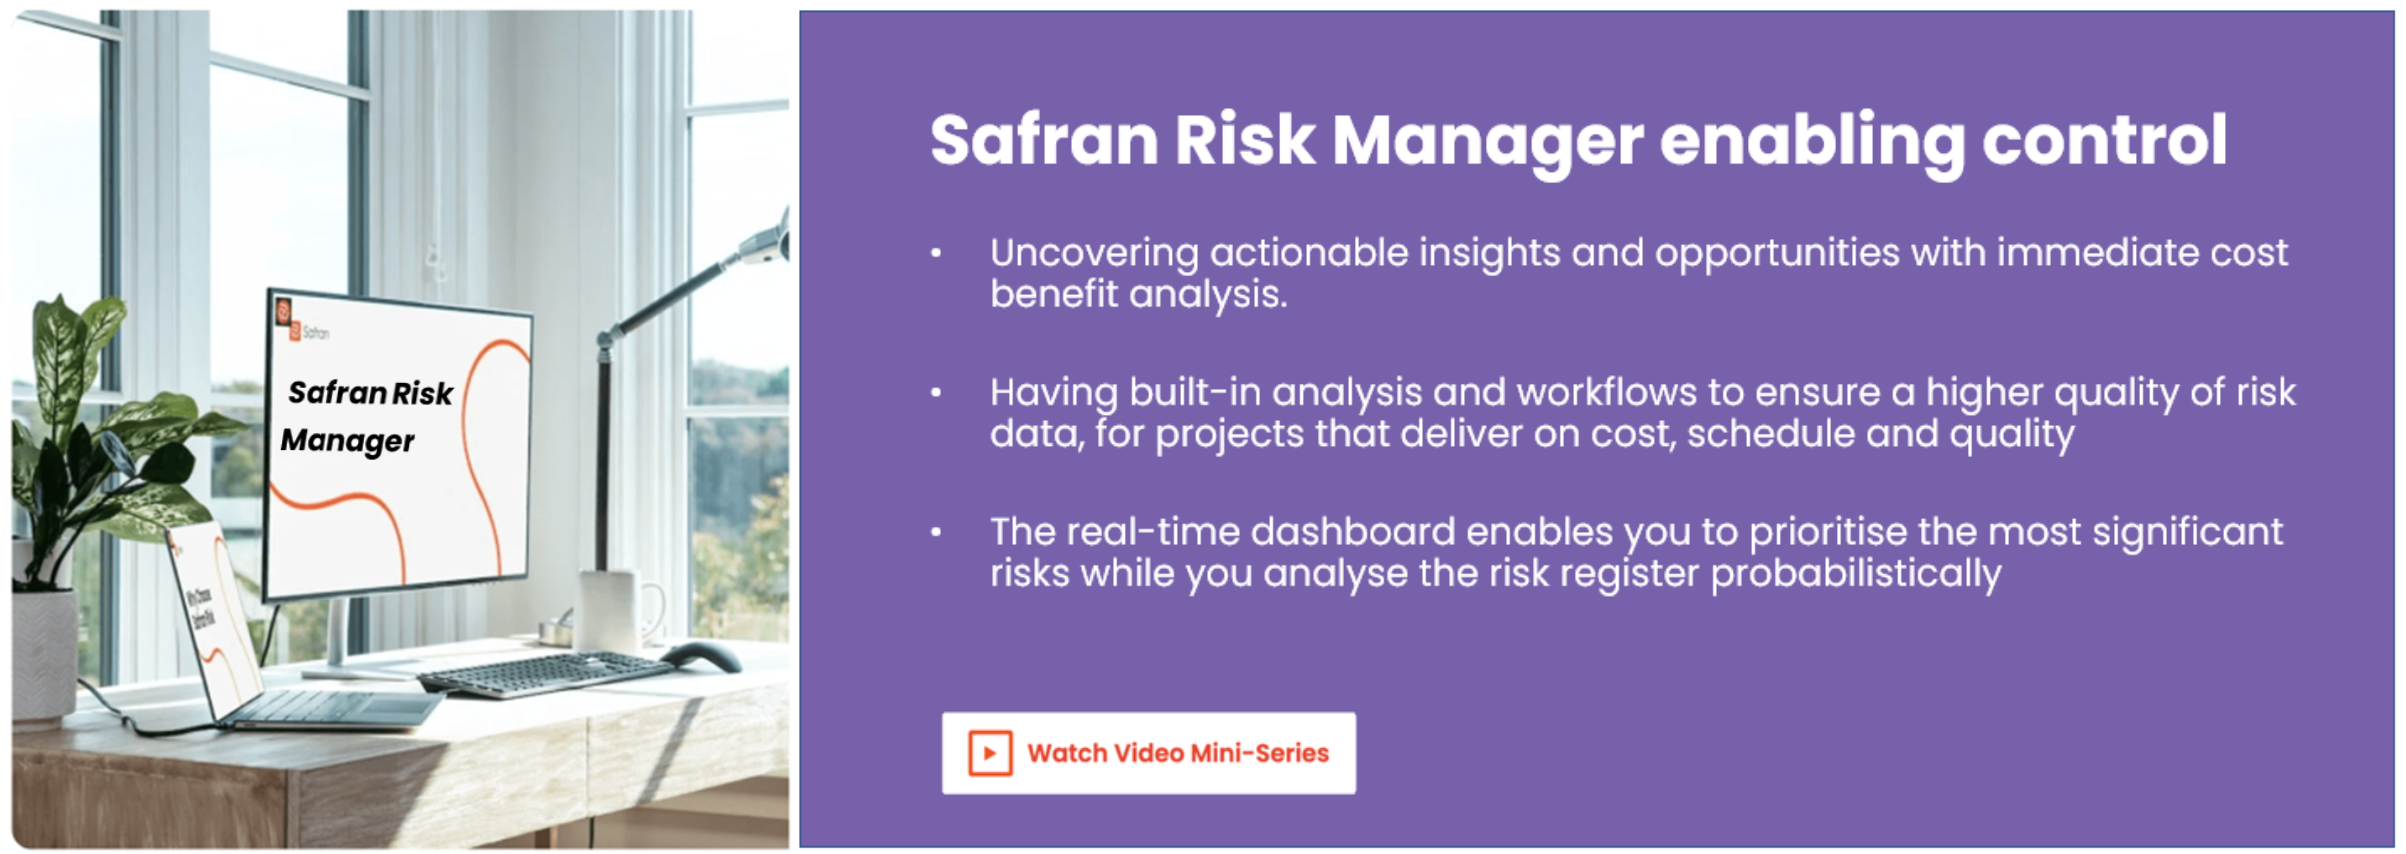
This experience, along with others, eventually helped shape Safran Risk Manager's design. By incorporating a specific project Portfolio Viewer facility to generate reports from data obtained from multiple projects, portfolio risk directors can access everything they need from within the same operating environment used by the risk managers. The integrated real-time dashboard also enables risk managers to quickly assess the live risk registers from multiple projects, allowing them to see the combined values across any combination of access-controlled projects.
So if you find you have a large number of separate projects that you need to review and report on, then you should consider a well designed database product like Safran Risk Manager. It will save you hundreds of hours a year in tedious data collection, and could even improve your annual bonus! Save Time, Increase Data and Reporting Accuracy and Enable Corporate Performance by contacting a Safran expert today.


