
Adopting a Hybrid Approach to Managing the Risk Register
The Quantitative Risk Data Question
Many people ask me about the benefits of using quantitative risk management approaches over their more traditional qualitative methods. They often see quantitative analysis as an expensive overhead, with little return other than a means to placate a demanding customer. Both methodologies provide significant benefits at different times in the risk management process. However, a hidden flaw in purely qualitative risk assessments could leave the project exposed to catastrophic failure if left unchecked.
Adopting a hybrid approach to managing the risk register can yield surprising results, highlighting potential savings and helping avoid disastrous results. What's more, through adopting the right software, such as Safran Risk Manager it may not be as difficult as it sounds.
What's The Risk Register Score?
To keep things simple, qualitative risk assessment can be thought of as the subjective assessment of the likelihood of a risk occurring and its impact on a project objective.
Such subjective assessments will use terms such as "Rare", "Possible", and "Highly Likely" for the likelihood; and "Negligible", "Major", "Severe", or "Exceptional" for impacts, remembering that impacts can be both threats or opportunities, so the language needs to reflect the appropriate state.
Qualitative assessments are most often conducted at the start of a project, when hard facts are not readily available, and time is of the essence to build the first risk register. Usually, the most cost-effective way to identify the risks within a new project is to convene a risk identification workshop. During this session, potential threats and opportunities are identified, and a qualitative gut-feel assessment from across the team is captured. This method relies on the Wisdom of Crowds approach, and often produces some sound baseline assessments.
Once a qualitative risk assessment is complete for all the identified risks, then a qualitative risk analysis is usually conducted using a visual chart, often referred to as a risk matrix or probability impact diagram (PID) (see Figure 1a). Whilst such a matrix could be a simple table, the application of colour representing degrees of tolerance moves the basic probability impact diagram to a much more visceral representation of risk, and this is sometimes referred to as a risk heatmap (see Figure 1b).
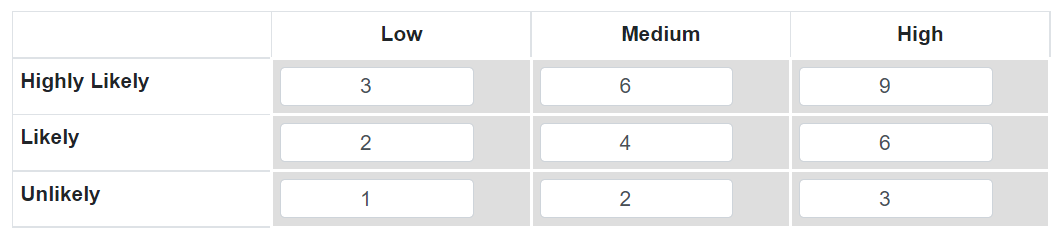
Figure 1a: Probability Impact Diagram or Risk Matrix
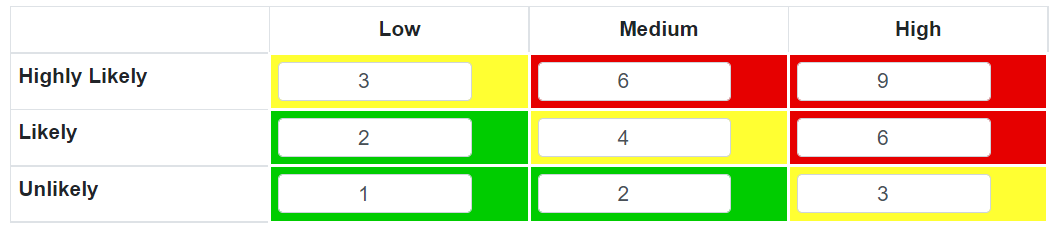
Figure 1b: A Coloured Heatmap
Comparing Risk Scores Across Projects
The outcome of the analysis will result in a risk score based on the corresponding cell of the matrix. The trouble with this approach is that a subjective qualitative assessment has resulted in a number. When people see numbers, they often think of them as being objective, quantified data.
This is the first trap that a risk professional needs to avoid. Why? Because a risk score can very easily change when considering the same assessment in a different project context. On a million-dollar project, a catastrophic impact may represent a hundred thousand dollar value. Yet this same impact value on a billion-dollar project would be potentially inconsequential. The same risk, when analysed on different risk matrices, results in a different risk score! This makes comparisons of qualitative risk scores across portfolios of projects almost impossible, particularly if the projects are of vastly different size and complexity.
By the time the probability impact diagram analysis is completed, the project should have a much clearer understanding of its risk environment. It should have a comprehensive list of risks, and it should have prioritised those that it believes are outside of tolerability. While some projects will rest on their laurels at this point, doing so could prove catastrophic, as the qualitative probability impact diagram analysis has a significant hidden danger – tombstone risks.
Spotting The Tombstone Risks
A significant shortcoming of the qualitative risk score as a number is that it can obscure the low likelihood - high impact risks by assigning them a middling risk score. Why is this important? Just because a risk has a low likelihood of occurrence does not mean it will not occur. If the risk does occur, then it will have a high impact on the project objective. Due to the 'upper end' nature of the matrix, e.g. "Severe > $X", a high impact risk may well be many times greater than the next largest impact but would still be placed in the same right-hand cell on the matrix. When risk scores are ranked, the high likelihood - high impact risks will be at the top, with the low likelihood - high impacts falling into the middle ground. This is usually the same scoring area as the high likelihood - medium impact risks, which may not pose such a threat to the project objective. Should one of these extremely high impact – low likelihood risks be presented in the middle ground, its significance should it occur could well be missed.
These extremely high impact – low likelihood risks are sometimes termed tombstone risks. These risks, above all others, are the single most important reason why a minimum quantitative analysis should be conducted, since finding just one of these risks can save an entire project. The easiest way to see them is to look for the pure impact value in the risk register! It is much easier to see a million-dollar impact as a number. Of course, this does require an estimation of the impact value. However, even a rough order of magnitude estimation should be sufficient to highlight a tombstone risk.
Unfortunately, many risk registers built on spreadsheets will factor the impact by the likelihood. So if a million dollar impact has only a one per cent likelihood of occurrence, then its factored impact would be ten thousand dollars. Again, such a value may well be relegated to the middle of the risk pack. However, a Monte Carlo model of the risk register can very quickly identify that one or more of these killer risks exists within the data (Figure 2)
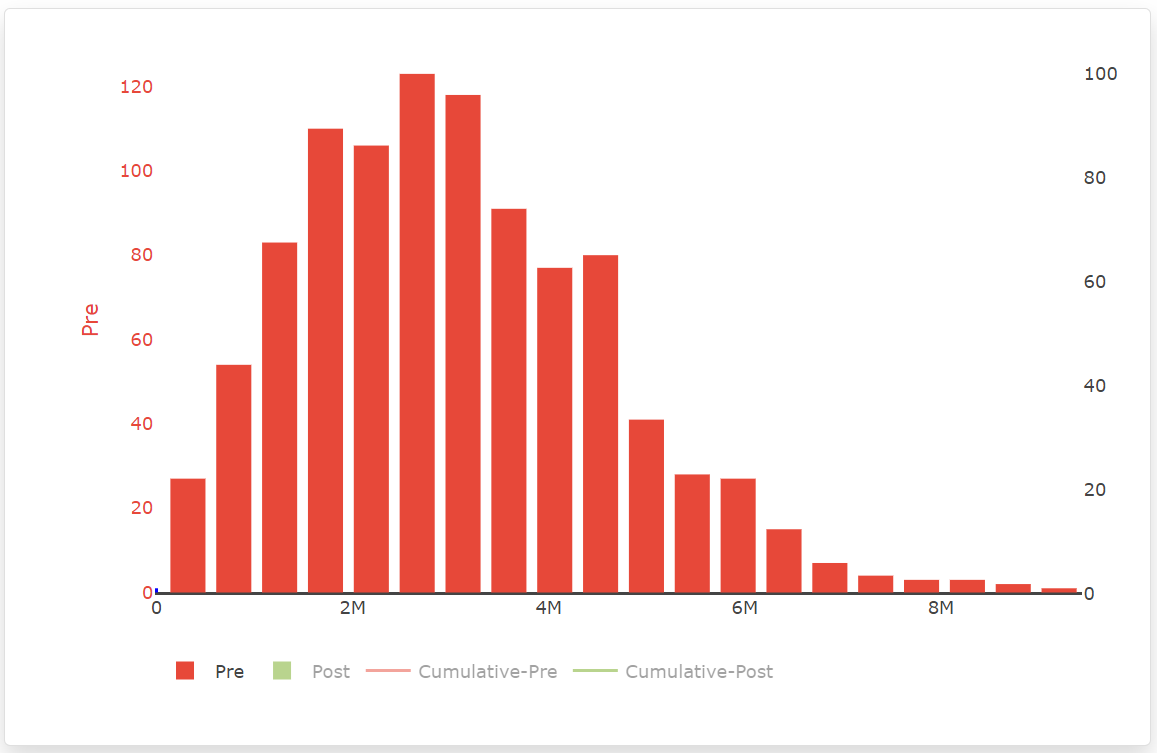
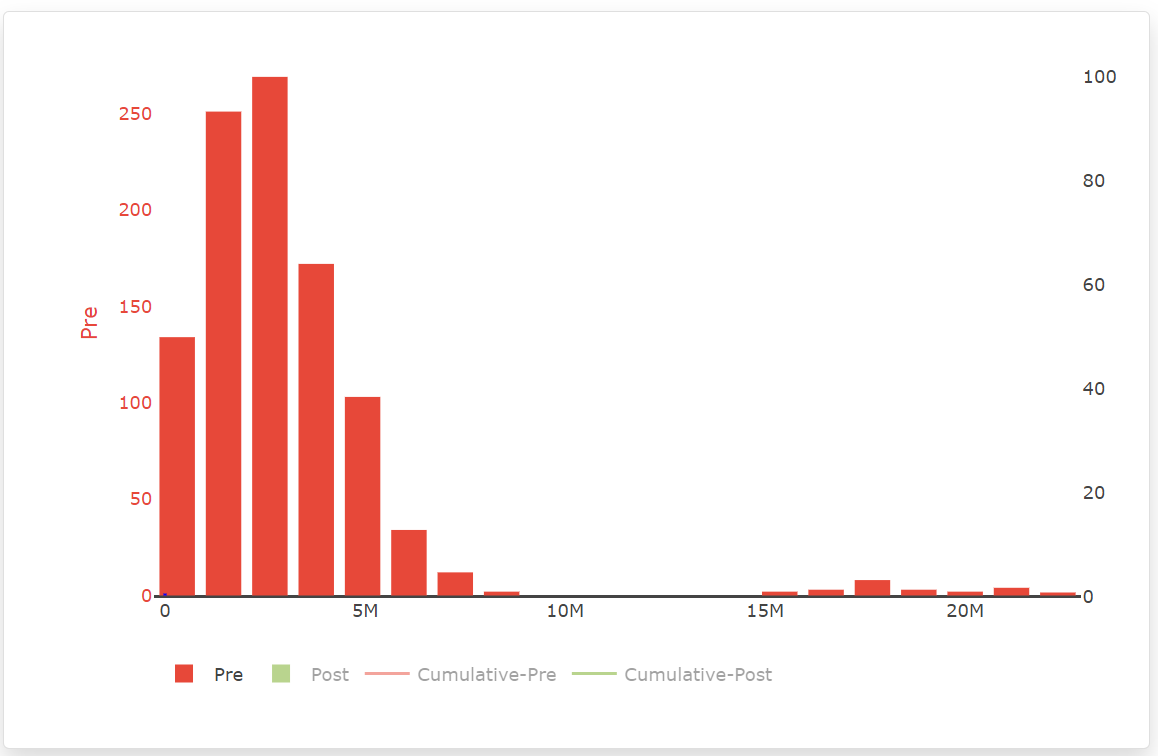
Figure 2: Comparison between a project model without and with a tombstone risk
As can be seen from Figure 2, the introduction of a single tombstone risk creates a distinctive long tail to the right-hand side of a Monte Carlo simulation. Of note, the qualitative assessment score for this one critical risk actually places it into the green tolerable zone for this particular project (Figure 3). If a quantitative assessment had not been conducted, this particular project could well have failed if that one risk had occurred.
One of our customers reported discovering a tombstone risk, saying that this one analysis had paid for buying Safran Risk Manager a hundred times over.
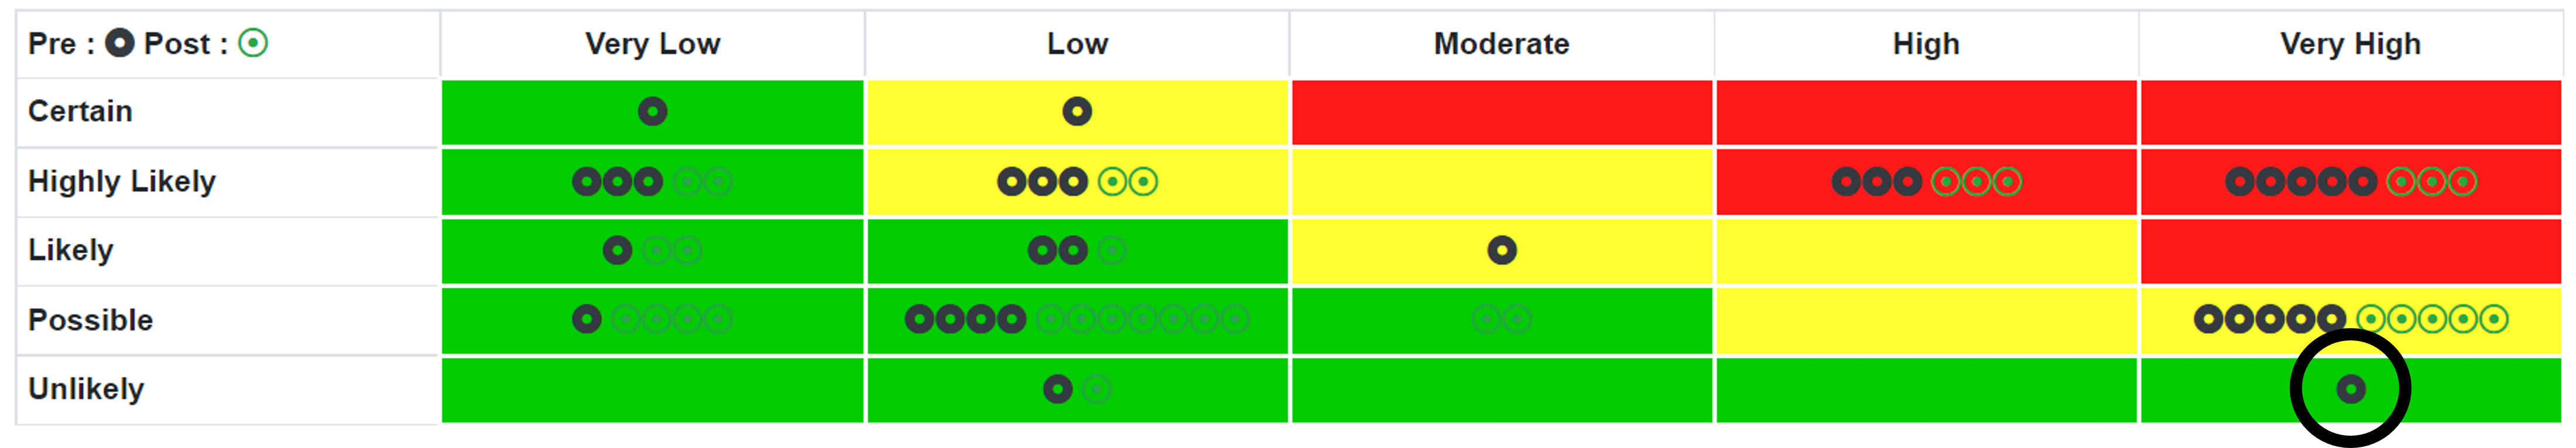
Figure 3: The qualitative assessment of the same tombstone risk
Taking Action on Threats and Opportunities
After considering the initial qualitative likelihood and impact of a risk, the next logical step is to determine what actions steps should be taken to treat such threats, or promote such opportunities that lay outside of the tolerable zone?
In the traditional probability impact diagram, the Post-Treatment values would be assessed with consideration to their new qualitative likelihood and impact, and the result would be plotted onto the matrix such as in Figure 4. This should be used to answer the question: Will the resulting risk be within tolerance?
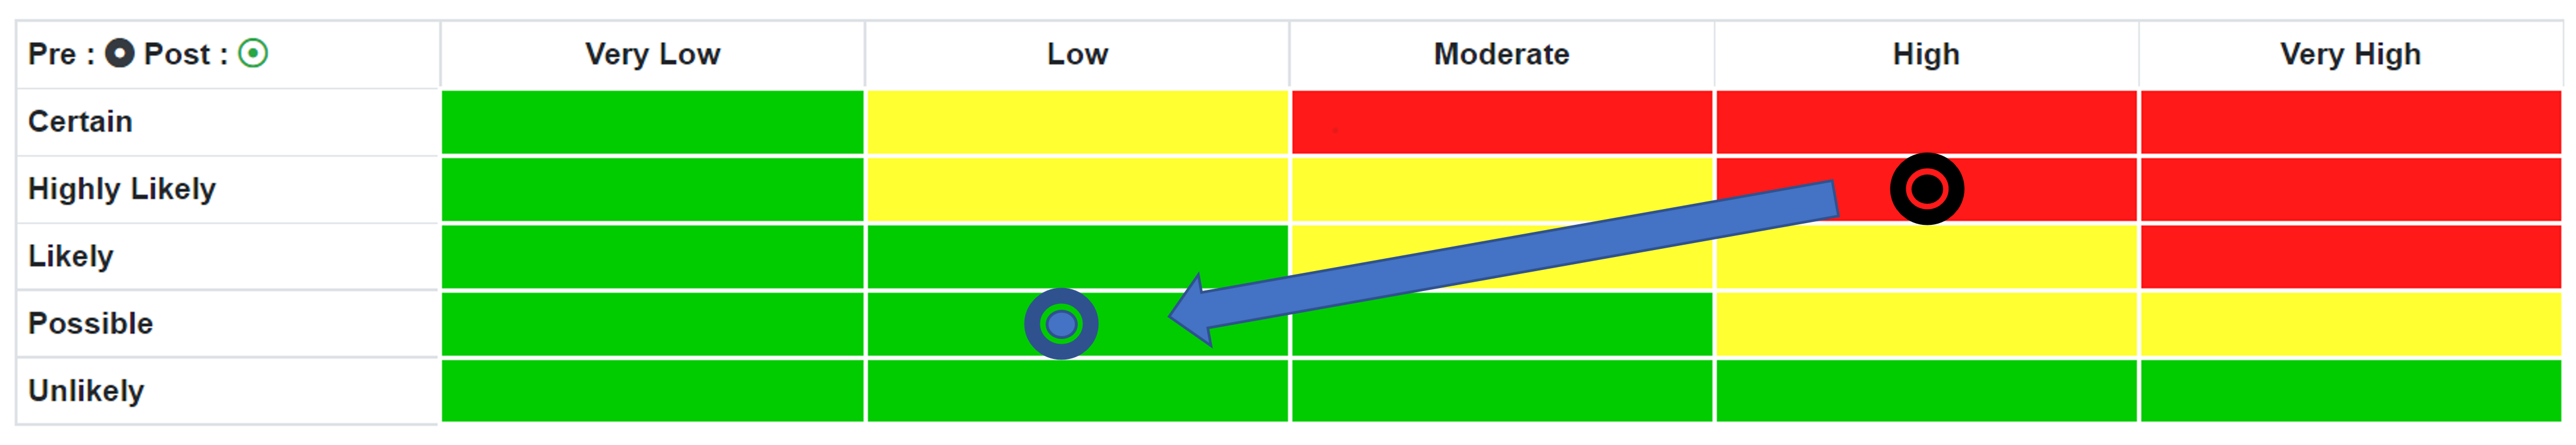
Figure 4: Qualitative Pre and Post-Treatment Positions
The Post-Treatment position can now also be associated with a Post-Treatment score – but watch out to remember that a score is not a quantification value!
This approach of guessing the benefit derived from a particular action comes with considerable uncertainty. For example, the qualitative assessment does not provide any insight into the cost of the action to achieve the end goal. After all, the action to move this $10,000 risk from red to green may in fact cost more than $10,000! As such it would be better to not treat the risk at all, and simply tolerate it should it occur.
The obvious solution is to quantify the Pre-Treatment and Post-Treatment position along with the likely cost of the actions to treat it. Armed with this data, it becomes a matter of simple maths to determine how much benefit is derived from the action. Such calculations can be either an absolute value or presented as a benefit ratio, as per Figure 5. Through identifying such data, the project team can now identify where their limited resources can achieve the most impact.
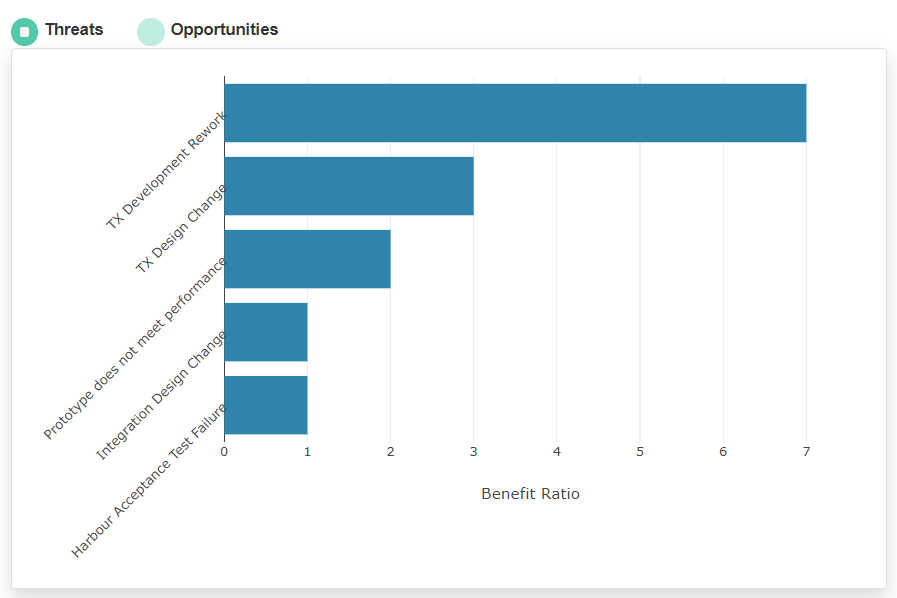
Figure 5: Cost Benefit Ratio Chart
Analyzing Quantified Pre and Post-Treatment Data
Another way of looking at quantified Pre and Post-Treatment data is to model it on the Monte Carlo simulation, and overlay the results as a histogram. In Figure 6, it can be seen that the red Pre-Treatment histogram has significantly shifted to the green Post-Treatment position. Of note in the example is the higher number of zero values occurring in the Post-Treatment position. This would indicate that significantly fewer risks are occurring in the Post-treatment simulation than in the Pre-Treatment simulation. Such change in occurrence happens when treatment is made to affect the likelihood of the risk occurring. These are usually termed preventative actions, as compared to protective actions which primarily affect the impact.
Figure 6: Pre and Post-Treatment Histogram
Another way to look at the quantified affects of action is to look at the cumulative distribution curve, often referred to as an 'S' curve. To read such a chart, the right-hand axis is used. This chart indicates the degree of confidence at any given value. In the example in Figure 7, it can be seen that the red Pre-Treatment confidence at $100K is just over 30% whilst the green Post-Treatment confidence is over 80%.
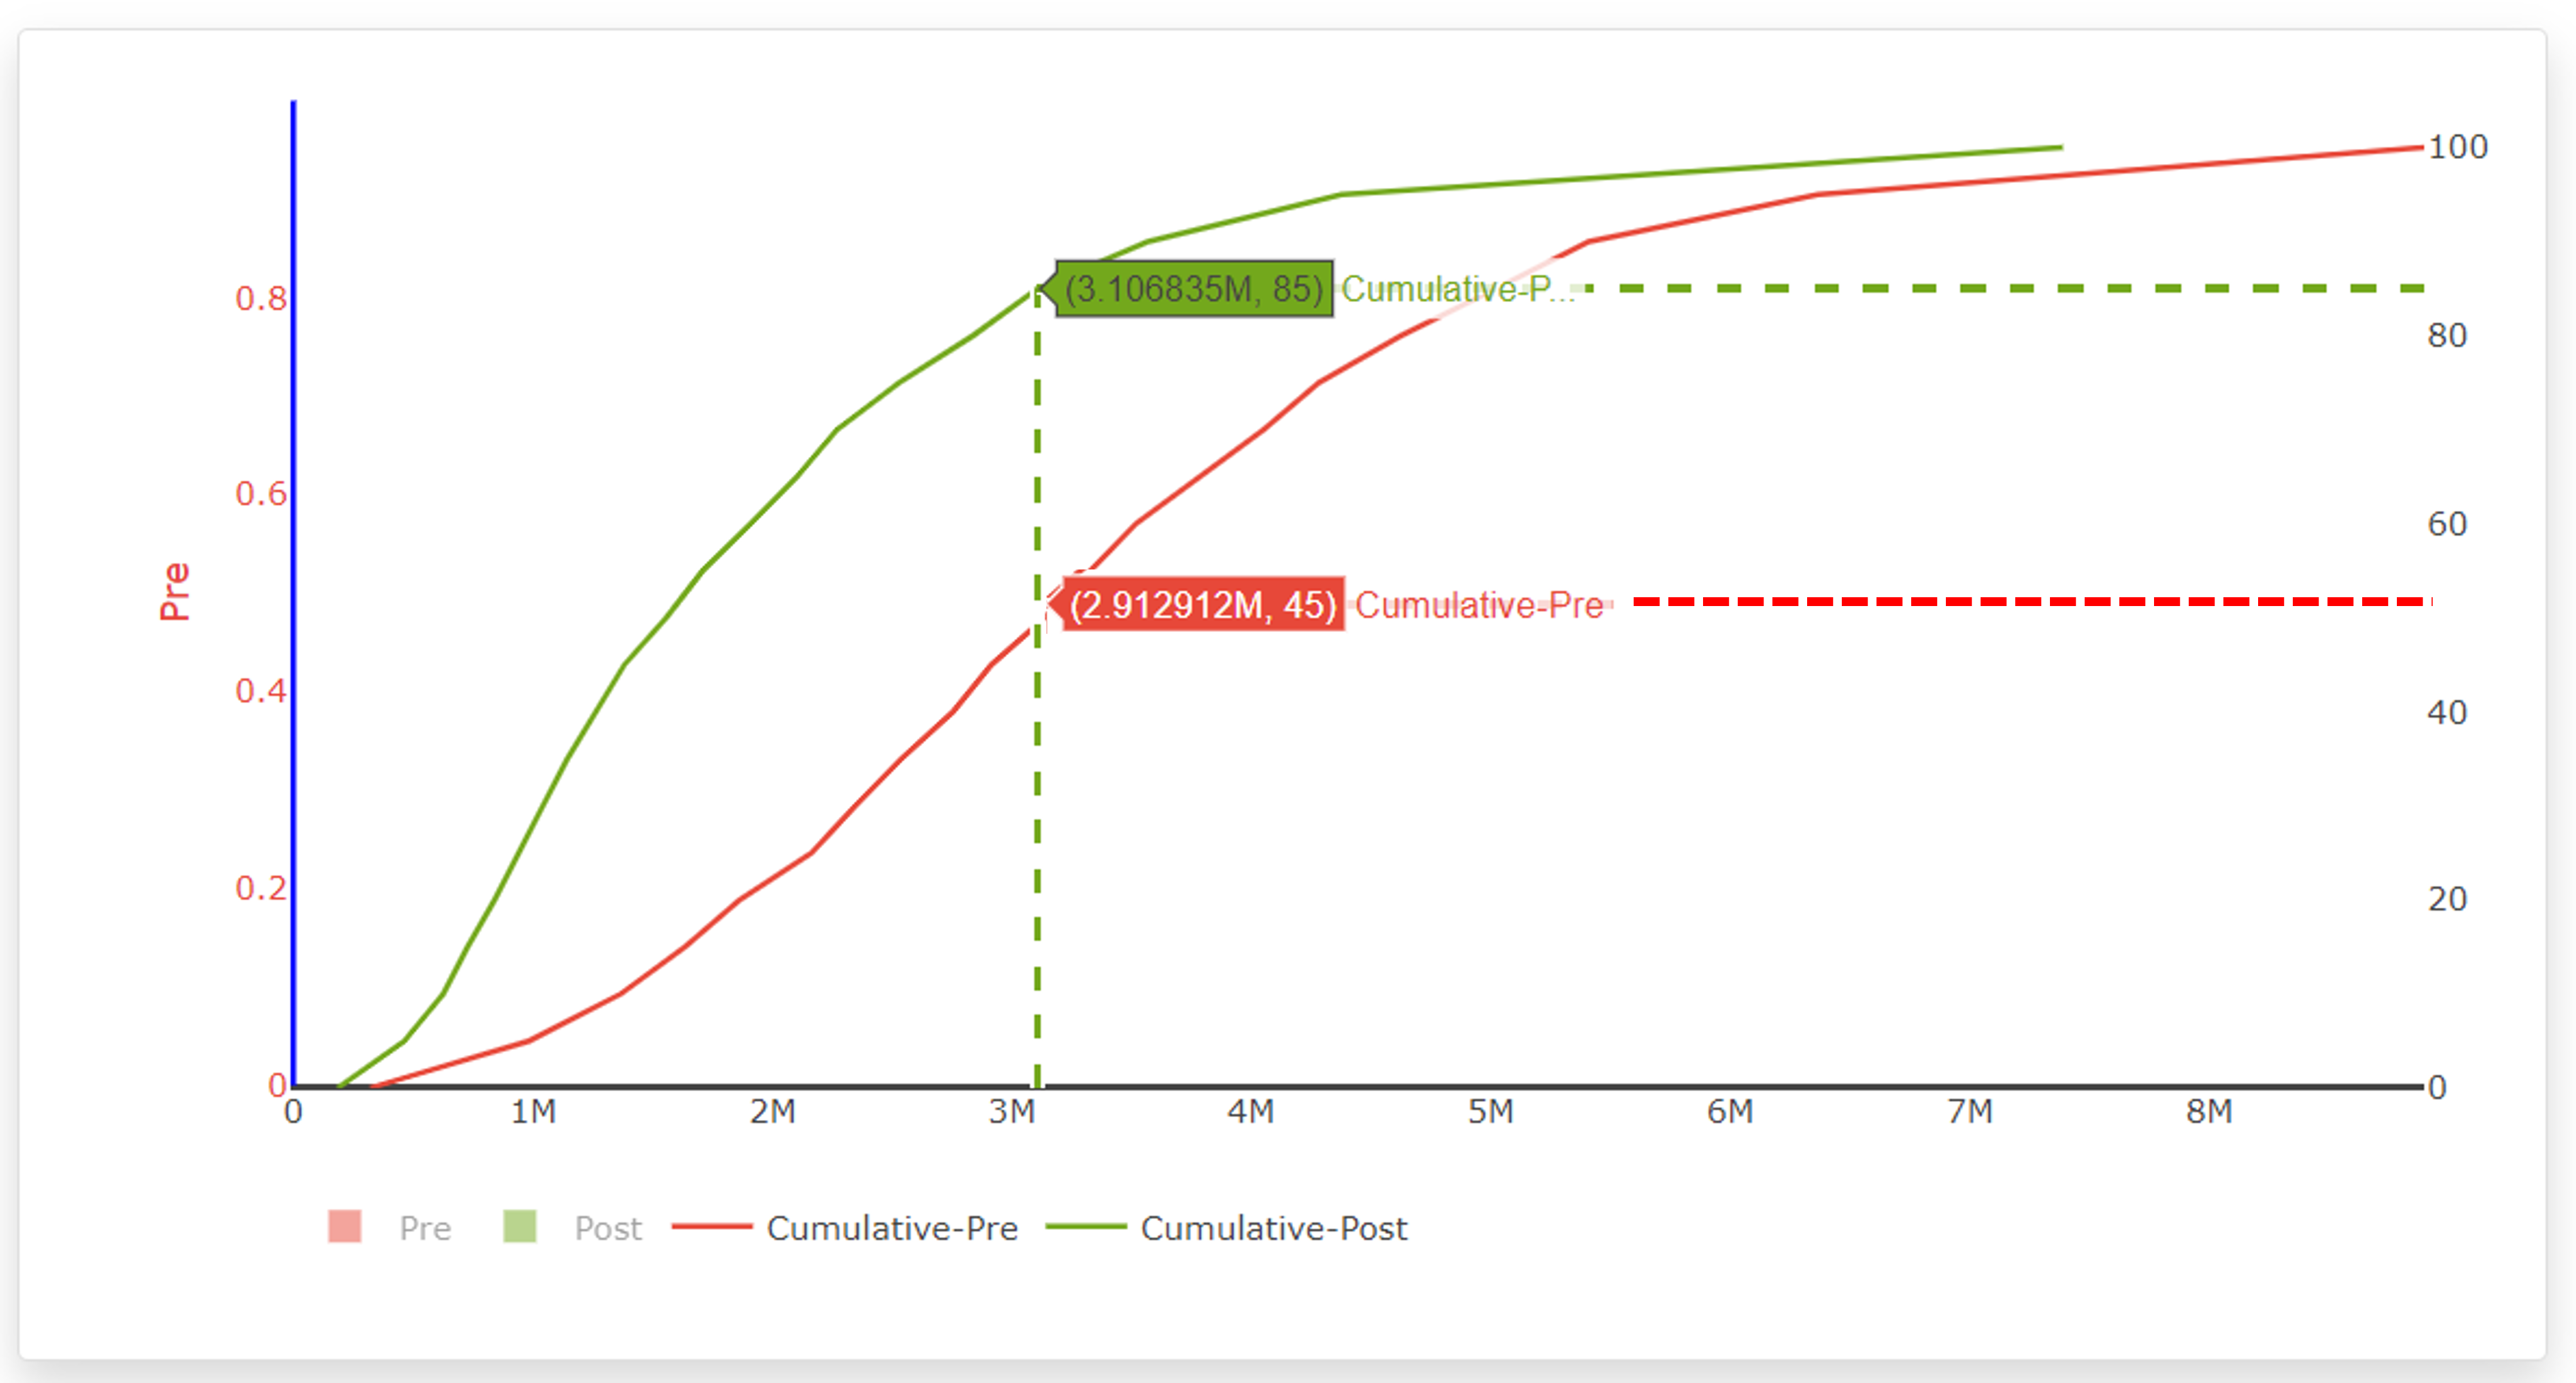
Figure 7: Pre and Post-Treatment Confidence Values
A tool that enables both qualitative and quantitative assessment of risk data
Having one tool that enables both the qualitative and the quantitative assessment of risk data at the same time enables the best of both approaches to be applied. Safran Risk Manager has been designed to achieve precisely this. With a real-time dashboard that instantly displays the charts identified in this article, it is incredibly easy to spot the hidden tombstone risks, whilst also identifying where actions have the most impact on risks. With such data, the confidence of contingency budgets can also be assessed.
The user interface allows a qualitative assessment to be made quickly, aligned to the default project probability impact diagram (PID). This simultaneously produces a rough order of magnitude quantitative assessment value which can either be accepted as is, or modified based on the user knowledge of the risk. In so doing, the probability impact diagram is populated with data which can be quickly recalculated against any other probability impact diagram, whilst at the same time a quantitative Monte Carlo analysis is automatically generated. Combining these two analysis methods allows the hidden tombstone risks to be uncovered instantly.
By identifying actions and their corresponding anticipated costs, the cost benefit ratio models easily enable the project to identify which risks benefit the most from the investment into actions before a single penny is spent.
Safran Risk Manager can:
Identify the hidden dangers of tombstone risks – potentially saving the entire project
Determine which risks benefit the most from the identified actions – potentially saving wasted investment in expensive or unnecessary actions
Allow risk data from multiple projects to be assessed both qualitatively and quantitatively – enabling a project portfolio view
Contact a Safran expert today for more information, or to arrange a free trial of Safran Risk Manager.
