Risk is one of the most intricate and variable aspects of a project, and it is vital that all stakeholders have an awareness of risk analysis and management.
It can be difficult to communicate the magnitude and complexities of risk to a lay audience, and so understanding the most effective ways to express and report risk is a must for risk managers, particularly in high-risk capital projects.
To simplify one aspect of risk reporting, we have compiled a list of the 5 most useful risk reports, as well as notes on when and where each could be used most appropriately.
Sensitivity Analysis
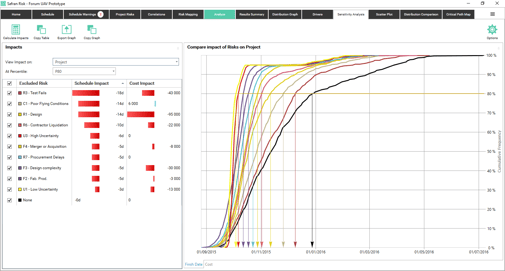
Sensitivity analysis is useful for ranking those risks that are having the most significant impact on the duration or cost of either the the overall project or any of the key project milestones.
This improves on the more traditional tornado reports by ranking the risks by their contribution in time and money, rather than an arbitrary ranking.
The ability to instantly view this information for key project milestones allows the team to hone in on those risks that could impact the near-term objectives whilst also being mindful of the long-term project goals.

Scatter Plot

The scatter plot provides the information you need to assess the combined probability of finishing within a certain date and budget.
By visualising the relationship between the cost and finish dates calculated during the risk analysis the scatter plot clearly demonstrates how often our project falls within the defined acceptance criteria (green) and those occasions on which we fall short on both cost and finish date (red).
This can be particularly useful when considering various different scenarios or mitigation strategies where performing the additional actions can carry significant cost.
Risk Trending
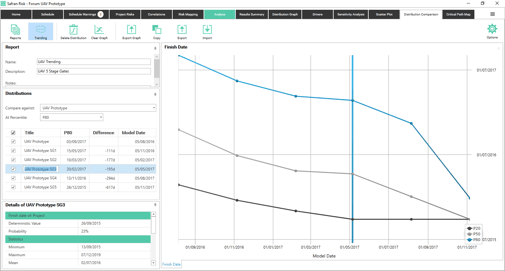
Risk trending allows you to track the performance of your project at the frequency most applicable to your organisation or the project at hand. It will automatically report on your chosen percentiles, providing invaluable information that can be used as part of an internal or external review cycle.
This can allow managers to observe whether risk is increasing or decreasing over time and to measure the effectiveness of risk aversion strategies and make any necessary amendments before it’s too late.
Distribution Graph
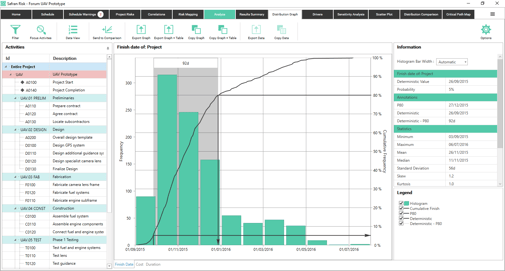
The distribution graph is a mainstay of any quantitative risk analysis. The graph plots all the possible outcomes from the analysis and can be used to indicate the likelihood of a project, or any activity within that project, finishing by its deterministic date or cost.
Contingency windows can also be drawn to visualise the available contingency between the deterministic value and any selected confidence level.
Drivers (Tornados)

The risk driver (or tornado) charts in Safran present key information on which risks and activities are significantly influencing our chances of meeting the project objectives.
The importance of the activity tornado should not be underestimated, as it takes into account the effect of risks on the activities, something the traditional critical path cannot do. As a result this report is often used to assist project teams in focusing resources when and where they are most likely to provide a positive outcome.
An Invaluable Tool
An understanding of these 5 methods of risk reporting is vital in maintaining effective communication between risk managers and specialists in other departments of the project. It can also secure the future of the project, in terms of predicting potential areas of loss and guiding mitigation action.
Safran Risk software can organise data into a range of different reports to give a substantive outline of risk assessment throughout the entire project. For a free 30-day trial, follow the link below.
