
We have discussed the historical origin and use of Gantt charts and now we will take a closer look at the steps required before you create your Gantt chart. In its simplest form the Gantt chart shows activities as bars displayed against time. These bar charts allow you to visualize time and resources throughout a project.
Whether you create the Gantt using pencil and paper, using applications like PowerPoint or Excel or use scheduling software here are the basic steps that will help you to create a helpful Gantt chart. With some careful planning, you can deliver positive outcomes no matter what technology, platform, or software you use.
IDENTIFY THE PURPOSE OF YOUR GANTT CHART
The first thing to consider is the purpose of your Gantt. Is it an overview picture of the project schedule? Who is the audience for your Gantt chart? Will the Gantt chart be used to update the status of activities? What level of detail will you capture in this chart, e.g., all activities in the schedule?
When asking these questions, you may find that you end up with more than one Gantt chart to present the project schedule to different stakeholders. Planning tools like Safran Planner and Safran Project allow you to draw multiple Gantt charts from the same information and decide how to display your data — high level or detailed, summarized and organized to transform data to actionable information.
If you use tools like PowerPoint or Excel, you must make manual updates and if certain core assumptions change, you may have to start over from the beginning. That means the task of updating and revising your Gantt can quickly become overwhelming. Using software that is not intended for project planning and scheduling can make your Gantt charts more time consuming and result in difficulties in long term planning and statusing. You’ll benefit by using a purpose-built planning and scheduling tool, like Safran Planner and Safran Project with their flexibility and formatting capabilities.
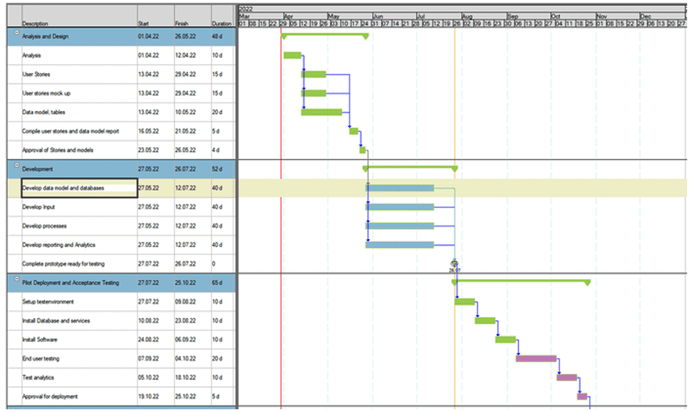
Sample Chart Sectioned Using Swim Lanes and Logic Showing Flow of Work [Safran]
GATHER BASIC PROJECT INFORMATION
You can’t build a Gantt chart without some basic project information. The following questions will help you gather the details required to quickly sketch out the plan.
- What is the timespan of the Project (Project start and finish)?
- What are the major deliverables (Project breakdown)?
- How will you get to those deliverables and what are the deadlines?
- What is the list of activities for the steps to get to those deliverables?
- What are the durations of each activity?
- What are the milestones?
- What are the dependencies that can impact the project timeline?
- When are there holidays and non-working periods where work cannot be planned?
- How many working days are available per week?

PLAN THE GANTT CHART
Having defined the purpose of the Gantt chart and collected the basic project information, you can start planning the level of detail for your Gantt chart. A few of the essential questions to answer include:
- What level of detail best supports the purpose of this chart?
- Should the timespan be in days, weeks, months, or years?
- What data columns or information should be displayed?
- What bars should be added to the chart?
- How should the Gantt chart be grouped, sorted, and organized?
Here are some ideas that may make your Gantt charts more valuable communications and planning aids. Consider integrating the following into your Gantt chart:
- Conditional formatting and colors to highlight information
- Display logic that shows dependencies and sequencing of work
- Clear representations of the major deliverables and milestones
- How to highlight and display progress to the project
- How should the progress timeline be displayed?
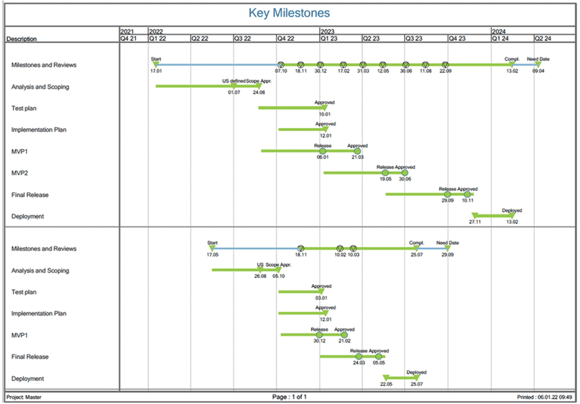
Sample Milestone Summary Chart [Safran]
Once you have defined the purpose of your Gantt chart, confirmed the important details of the project, and have a plan for the layout of one or more charts, creating these Gantt charts will be easier as you have done the preparation work.
The simplest and best tip is to make a Gantt chart for each scenario using a tool that makes it easy to update and manage. Safran Planner and Safran Project will support your work by creating the right layouts with the right content required to support the purpose of your Gantt chart.
Next we will provide tips on how you can enhance the Gantt chart by using color, multiple bars, selecting the right column information, creating summary charts or applying filters to highlight specific details in your schedule. And more.
.png?width=400&name=Safran%20Blog%20Series%20-%20Blog%202%20Graphic%20(Previous).png)
.png?width=400&height=200&name=Safran%20Blog%20Series%20-%20Blog%202%20Graphic%20(next).png)
