Strategic decision making with integrated master risk schedules
Introduction
A brief walk though of how to develop risk models that provide confidence in achievement of project outputs, programme benefits, portfolio objectives and enterprise mission.
This article will show how you can summarize data and roll up to levels where confidence ranges can be attained against more than just a project.
By understanding the range in delivery of P3M targets, business leaders can be more certain on delivering on their commitments, and can also understand how true top-down risks can materially impact delivery throughout their organisation.
One of the biggest challenges
One of the biggest challenges facing risk management as a profession is how to demonstrate value.
- How do we know if something was avoided through action?
or - Was it never going to happen in the first place?
Whilst we don’t know the future, we can use tools to predict it. These tools are often used extensively at project level to provide confidence around achievement of project outputs (outcomes), but few organisations use the same principles to predict programme outcomes and associated realisation of benefits.
Many programmes use master planning approaches to achieve this, but it is usually down to human interpretation of how to integrate multiple project schedules at a programmatic level. This often has the same limitations as trying to integrate complex packages of work at project level by human gut instinct, that is to say with best intentions, but falling far short of the reality when it arrives.
So why don’t we use the same tools at programme level as we do at project level?
The answer to this question is often simple, and based more on perception than reality; it’s too onerous.
The complexity in maintaining multiple schedules and associated uncertainty and risk profiles often means the lag time to run an effective QSRA is prohibitively long to get any information out in a “topical” period to act on it. Usually, by the time the QSRA has run, the information it was based on is weeks or even months old, and things have changed again in that timescale.
But does it need to be like that?
Pioneering Computer Scientist Rear Admiral Grace Hopper came up with the quote; The most dangerous phrase in the language is “we’ve always done it this way”
I constantly remind myself of this phrase, and work to achieve the converse in all areas of life if there is a problem with the ways in which things are done.
Just because something is hard doesn’t mean it is wrong. Yes, it takes effort and experience to build a QSRA system which supports programmatic outcome and benefit realisation, but it is far from onerous if done properly.
In fact, risk professionals have colleagues in the planning world who have already developed a system to summarize information in this way, it can be called the schedule hierarchy, but is more commonly known as the IMS (Integrated Master Schedule).
The Integrated Master Schedule (IMS) Project
The IMS integrates project, programme and portfolio schedules from a bottom-up perspective to give insights into how minor changes at project level can impact attainment of objectives at portfolio or enterprise level. The IMS is usually “soft linked”, meaning that a change at the bottom does not automatically flow to the top, but at each escalation point (Project>Programme, Programme> Portfolio, etc) a check is carried out and analysis completed to understand the root cause of date or cost changes before the information is flowed up to the business.
Again, this can be time consuming, and usually there is a valid reason for a change at the bottom manifesting at the top. As a business, we absolutely need to know the cause of issues bubbling up, but sometimes we need to be prepared to trust the data and act quickly. This is where overlaying QSRA principles on the IMS provides a good value proposition.
In the example below, we use the summation of project risks from Projects A, B and C, combined with programme risks, to forecast a confidence value for a given programme outcome.
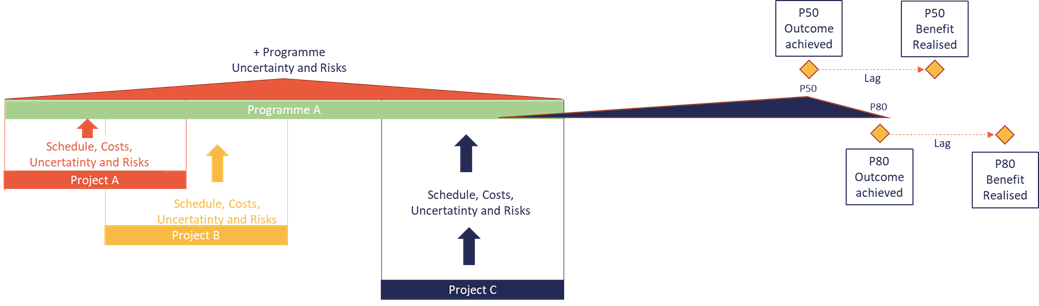
If we then apply this to other programmes, we can gain confidence around more than outcomes, we can measure against achievement of Benefits and Objectives as well.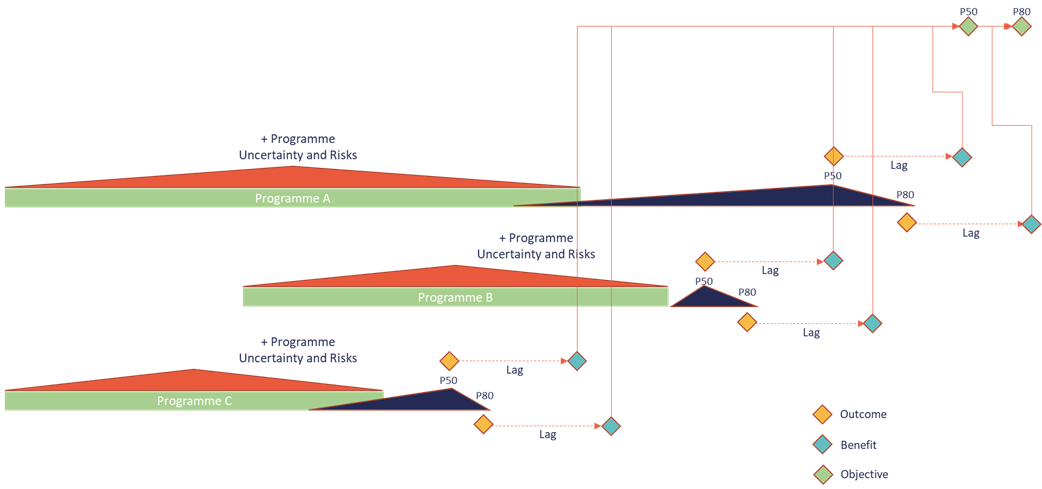
Organizations Today
Most organisations already have a large amount of the data required to produce this Integrated Master Risk Schedule (IMRS), and it would simply be a case of continuing to review risks at project, programme, portfolio and enterprise levels and understand how to map them to the IMS in a meaningful way, keeping an eye on changes that would affect uncertainty ranges, along with continuing to maintain topicality of the IMS to complete the exercise and unlock the value.
By understanding the implications of risks at all levels of your business, and acting on them in a meaningful and prioritised way to maximise achievement of business-level objectives which will fundamentally support achievement of mission and vision, you unlock the value of risk-based decision making.
Conclusion:
What would prevent you and your colleagues from implementing strategic decision making with Integrated Master Risk Schedules?
If you need help rolling out the suggestions outlined above, do contact one of our team members at Optimise-Risk UK.
We are experienced in successfully implementing IMRS in large organisations and can help you to avoid the pitfalls in doing so, and ensure the process is robust, fit for purpose and not overly time consuming. Have a look at our Customer Case Studies.
Click Here