The Dutch P85 mindset, not only a Quantitative Analysis
Embarking on a new project, especially one with critical deadlines, uncertainties, risks, and a lot of stakeholders, can be daunting. As project managers, we are tasked not only with meeting hard contractual milestones but also with ensuring the project's overall success collaborating with a lot of specialised disciplines, contractors and of course the governing owner.
One critical aspect of achieving this success is effectively managing schedule buffers and time contingencies. Today, we'll delve into how quantitative risk analysis, using our beloved Monte Carlo Simulations, helps us in giving insight into the feasibility of schedules.
The Dutch have been using this analysis extensively in the Infrastructure & Construction sector for many years and this has become a standard in how projects are tendered, executed, and communicated. Fundamental in the way project risks are identified, assessed, and collaborated on in the Netherlands is the usage the Risman methodology. This also adds an additional and different point-of-view.
Understanding a standardised owners’ requirement: P85 Milestones
With the introduction of a guideline in planning management in 2005, the Dutch Ministry of Infrastructure and Water Management have been leading the need for risk driven and integral project management, planning and scheduling. In tenders and project execution their guidelines and contractually agreed reporting standards are giving contractors an incentive to become more risk aware, resulting in more transparent, robust, and realistic schedules. For example, one of the recent large projects made Predictable – Controllable - Reliable as their core values, testing all deliverables and methods against these values.
By requesting insight into the P85 dates of key project milestones (dates with a statistically 85% likelihood of being achieved) the Ministry has contributed to a common risk culture, jargon, and way of working in the Netherlands.
Their guidelines have now also been adopted by other government-lead organisations, spreading the standardisation even further. Asking for distribution reports and dates is becoming a standard.
Leveraging Quantitative Risk Analysis
By utilizing the deterministic contractor schedule(s) as a basis, we incorporate uncertainties and risks (more on the identification and assessment of those later), allowing for a more realistic assessment of project timelines. Quantitative risk analysis, particularly Monte Carlo Simulation, provides a robust framework for analysing the scheduled buffers and necessary time contingencies for the P85 date of a key milestone. The quality and robustness of the schedules requires attention, making the contractors more aware of scope, complexity, and dependencies with stakeholders already.
Below an example of a resulting P85 finish date distribution:
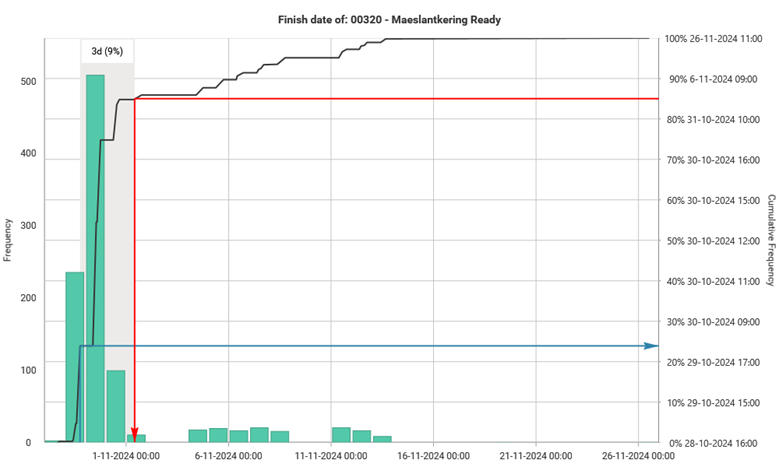
This typical visualization illustrates the feasibility of the deterministic finish date of a milestone and the date of the 85% likelihood. This gives insight into the needed size of a buffer (time contingency) for a milestone. Of course, it is also used to analyse the mitigating strategies for risks and uncertainties.
During project execution, the same analysis is performed on a regular frequency, taking progress and changes into account to see if the agreed buffer is sufficient. Addition of new risks and removal of risks allows for continued monitoring of the feasibility of promised delivery dates and remaining buffer. Transparency and consistency in analysis techniques ultimately contributes to better communication and adds trust for the Ministry, the Project Manager, and all other stakeholders. However, the Dutch are wary …
Should Risk Analysis solely focus on Quantitative Analysis (Risk Events and Uncertainty)?
Besides having a robust schedule, the most import input to perform a quantitative analysis is having insight into possible risk events and uncertainty. We all know that the quality and assumptions of the input has huge effect on the statistical outcome.
A lot of risk managers and analysts have been dealing with challenges around raising (project)risk awareness and having unified/standardised risk (communication) processes. Having collaborative identification, assessment and registration of risks is the first step in avoiding them.
A key challenge has been risk registration and assessment. Long lists (spreadsheets, documents and databases) have been drafted, discussed, agreed upon and ignored by many. Many Dutch companies are using a dynamic database toolset, also used for System Engineering, to capture risk.
Our partners at Safran also have a toolset that could assist us in getting rid of those documents. In a previous blog and webinar the value of the Safran Risk Manager solution has been discussed extensively (Click Here).
The Dutch have experienced that not having a unified way of collaborative risk communication is often the root-cause of unsupported risk processes and registers, and thus not having correct input for the quantitative analysis. That is why the Dutch have adopted a standardised risk management methodology for a lot of their projects already.
Dutch RISMAN-methodology creating common ground for a collaborative risk culture
Since 1995, the Dutch Infra- and Construction Sector have embraced a risk management methodology called ‘RISMAN’. Originally conceived by TwynstraGudde this methodology has evolved into a practical but also collaborative approach in project risk management.
The Dutch Risman methodology offers a structured approach to identifying and assessing risks and uncertainties. The methodology emphasises the cyclical process of conducting and embedding risk processes in the (project) organisation.
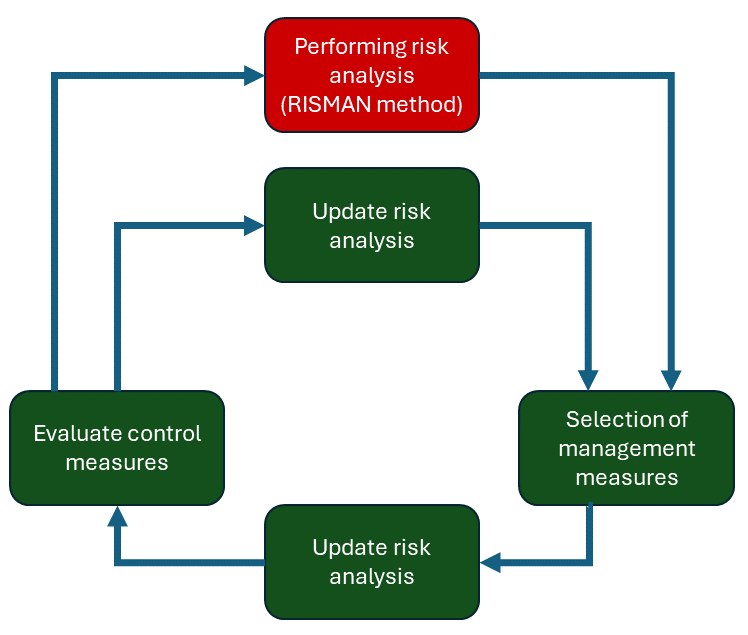
However, the most important basic element is not to have stringent standardised processes and detailed overviews of risk, but having a common collaborative risk culture and a dynamic approach to risk management in which it can really contribute to steering a project towards success. “Risk management as a product is nonsense!” is a good example (and perhaps a little blunt) of the open Dutch way of living.
A keep it simple attitude with a common jargon is key in getting a unified insight into risks. Using a semi-quantitative risk scaling register, a focus on root-causes and open discussions on mitigating actions (preventive or corrective) makes it possible for every stakeholder to join the risk discussion and have his/her input assessed. No registers with 1000+ rows and questionable thresholds and scales, but a governed register with an open risk-based discussion adding to awareness.
During assessments not only schedule and cost impacts are considered, but also impacts like environment, safety, sustainability and pollution. The latter is becoming more and more important. Having an open discussion allows the non-schedule and cost impacts to get more attention.
So, why do the Dutch still keep on looking at the P85 milestone dates?
The Dutch recognise that talking about risks is the first step in avoiding them. The risk identification and assessment culture brought by the RISMAN-methodology is a clear example of this, however the Dutch see that the element of time is a key part in large and complex projects.
Having a common element like schedule feasibility can thus be of great value for:
- Unified Communication: Establishing a common language and approach works great for communication between contractors and the owner. Aligning a common way of reporting streamlines the decision-making processes and enhances overall project coordination and control.
- Schedule awareness and insight into sub-critical paths: In order to perform a risk analysis, a robust model of the project schedule needs to be in place. This necessity raises awareness in Scheduling Best Practices. The results of the analysis itself (and communicating these within the project team) also gives insight into the fact that multiple (sub-)critical paths are present within the project and how much risk this adds.
- Buffer Analysis: Being able to forecast potential schedule slippage as early as possible allows the different schedule levels (owner, project manager, contractor, operational, etc.) to have some leverage in efficiency. But also, when issues occur, buffers can assist in still delivering scope on time and within budget. Insight and transparency (with clear governance) is key.
- Risk Contribution Analysis: Utilising modern quantitative analysis tools, like Safran Risk, gives us the options to analyse the contribution of a risk on a milestone or scope item. Next to having the risk register, giving us insights into priorities, we can now clearly communicate the driving risks and their contribution to the ‘risk profile’ of the selected P85 date. This way of communication makes the audience (stakeholders) more aware of possible impact by focusing on the driving risks.
- Analysable metrics across ‘comparable’ projects: In the modern data-driven world a lot of organisations are looking towards measurable and comparable data (or KPI’s). Having standardised (or comparable) points of measurement in schedules, like our P85 milestone dates (with added P10 and P50 dates), gives organisations the possibility to analyse risk profiles across the board and make better decisions.
The Dutch have learned a lot and Distribution Graphs are here to stay
In conclusion, the Dutch have been experiencing and experimenting a lot in the past decades with project risk management and analysis. Although a lot of value can be added in projects by adding and embedding fundamental risk management processes, we recognise that not every project (organisation) is the same. Fit-for-purpose and keeping it simple remain fundamental elements in the Dutch risk philosophy and approach.
Leveraging quantitative risk analysis, specifically Monte Carlo Simulation and Buffer analysis, still allows for insights worthy of investigating. Discussing the contribution of (individual) risks and their effect on the feasibility of projects in a unified way (for example our beloved Distribution Graphs) adds to a common risk-averse and -driven culture. Starting to use these metrics across projects and on organisational and program level is something the Dutch are very enthusiastic about, especially since integral planning and cross-project risk management is becoming increasingly relevant.
Sources and Links (Dutch Language):
- https://www.twynstragudde.nl/expertise/risicomanagement-en-projectbeheersing/risman
* Use the Google translate option for these web pages. - Rijkswaterstaat Handreiking Planningsmanagement 2019.pdf
* This PDF file can be translated using DeepL AI by using this link: Click Here