Exploring the importance of robust risk definition in the QRA process
How important is it, and why? In this article we will put greater focus on the front-end process that supports QRA, enabling the QRA process as a whole to become more efficient, as inputs are robust & routinely challenged as part of the standard process.
We'll explore common pitfalls, such as risks phrased: "there is a risk of delay" - driving greater clarity on the risk cause & actual risk event, as well as ensuring correct risk mapping for the model itself.
Let's get started
When it comes to QRA, most peoples' thoughts jump to the end of the process – the outputs: the histogram, the P50, the tornado charts, etc. We’re missing a trick if we don’t recognise that the inputs are one of the most important parts of QRA; without robust data going into the model, you’re not going to get robust data coming out of the model. “Garbage in, Garbage out’.
The aim of this blog
To offer some thought around one aspect of project risk inputs: the risk description.
This may seem like an insignificant piece of the puzzle however, in my view, risk definition is an undervalued, overlooked key to unlocking powerful risk management (and beyond just QRA). The context of this article is the development of a risk model in a project setting.
We’re all taught that a risk description is made up of 3 key pieces of information: the cause, the event and the effect. How many of us remain diligent around separating out these pieces of information, particularly when we’ve been asked for a quick turnaround? We’re all guilty of it from time to time; what I want to highlight is that when it comes to preparing for QRA, it’s worth starting off with a review of the risk definition as this will help feed the rest of the process.
For example, how many of our risks don’t actually describe the uncertain event?
“There is a risk of delay”. “There’s a risk of increased cost”. What these descriptions tell us is that we’ve not clearly articulated what the risk event itself is. If we don’t know the event, how can we get to the root cause (and thus target risk response effort), and how can we have any chance of quantifying what the impact might be?
Tip: utilising a bow tie analysis approach might help improve risk description
When it comes to risk identification, we must bring some structure and rigour back to describing risks; for all of my identification workshops I have a number of golden rules which include:
- Causes must be a known fact, not a future event or possibility.
- Effects shouldn’t contain any reference to the number of weeks' delay or additional cost – they should be descriptive, eg, describe the activities that will have to take place if this risk materialises.
Top Tip: Include an element of quality assurance during the workshop, either the facilitator or assign a member of the group to perform this role. Their job is to make sure that all the rules have been followed, and to challenge any discrepancies. Asking a member of the group to perform this role has other benefits as well, including reducing the risk of groupthink (and other group-biasing factors) as well as up-skilling the team with better Risk Management knowledge.
Try the following approach as one way of improving your risk descriptions. When we ask groups to identify risk, most people naturally describe the impact of the risk: “there’s a risk we’ll be late/go over budget/delay something”. We use this as a starting point to work backwards; why will we be late for this particular deadline? Why might we go over budget for this particular work package?
Let’s take an example: There’s a risk that package 6.1 will be delayed and cost more money.
Why? There are lots of people working in the same area at the same time, it’s a congested construction site.
Why? There are some spatial constraints because of existing infrastructure in the area where we’re constructing the new platform; we need to install the new platform before we can demolish the existing infrastructure. It’s also a live, operational area so as well as the construction team, we also have all of the operators on site. In addition, we’ve not finalised the phasing plan and we’ve not agreed any local working arrangements with the operators. Then build the risk back up. As a result of:
- Spatial constraints due to existing infrastructure which needs to remain in place until the new platform is erected
- The construction area is a live operational area with construction team and operational team working at the same time
- The phasing plan has not yet been finalised
- There are no local working arrangements with the operators
There’s a risk that the erection of the platform (part of package 6.1) cannot be completed in the assumed phasing.
This will result in the need to review working arrangements and sequencing, eg, night-time working, or extended shifts that are staggered around peak operational times.
Note: These options may form the basis of your 3-point estimate or, during assessment discussion, it might become clear that only one option is viable.
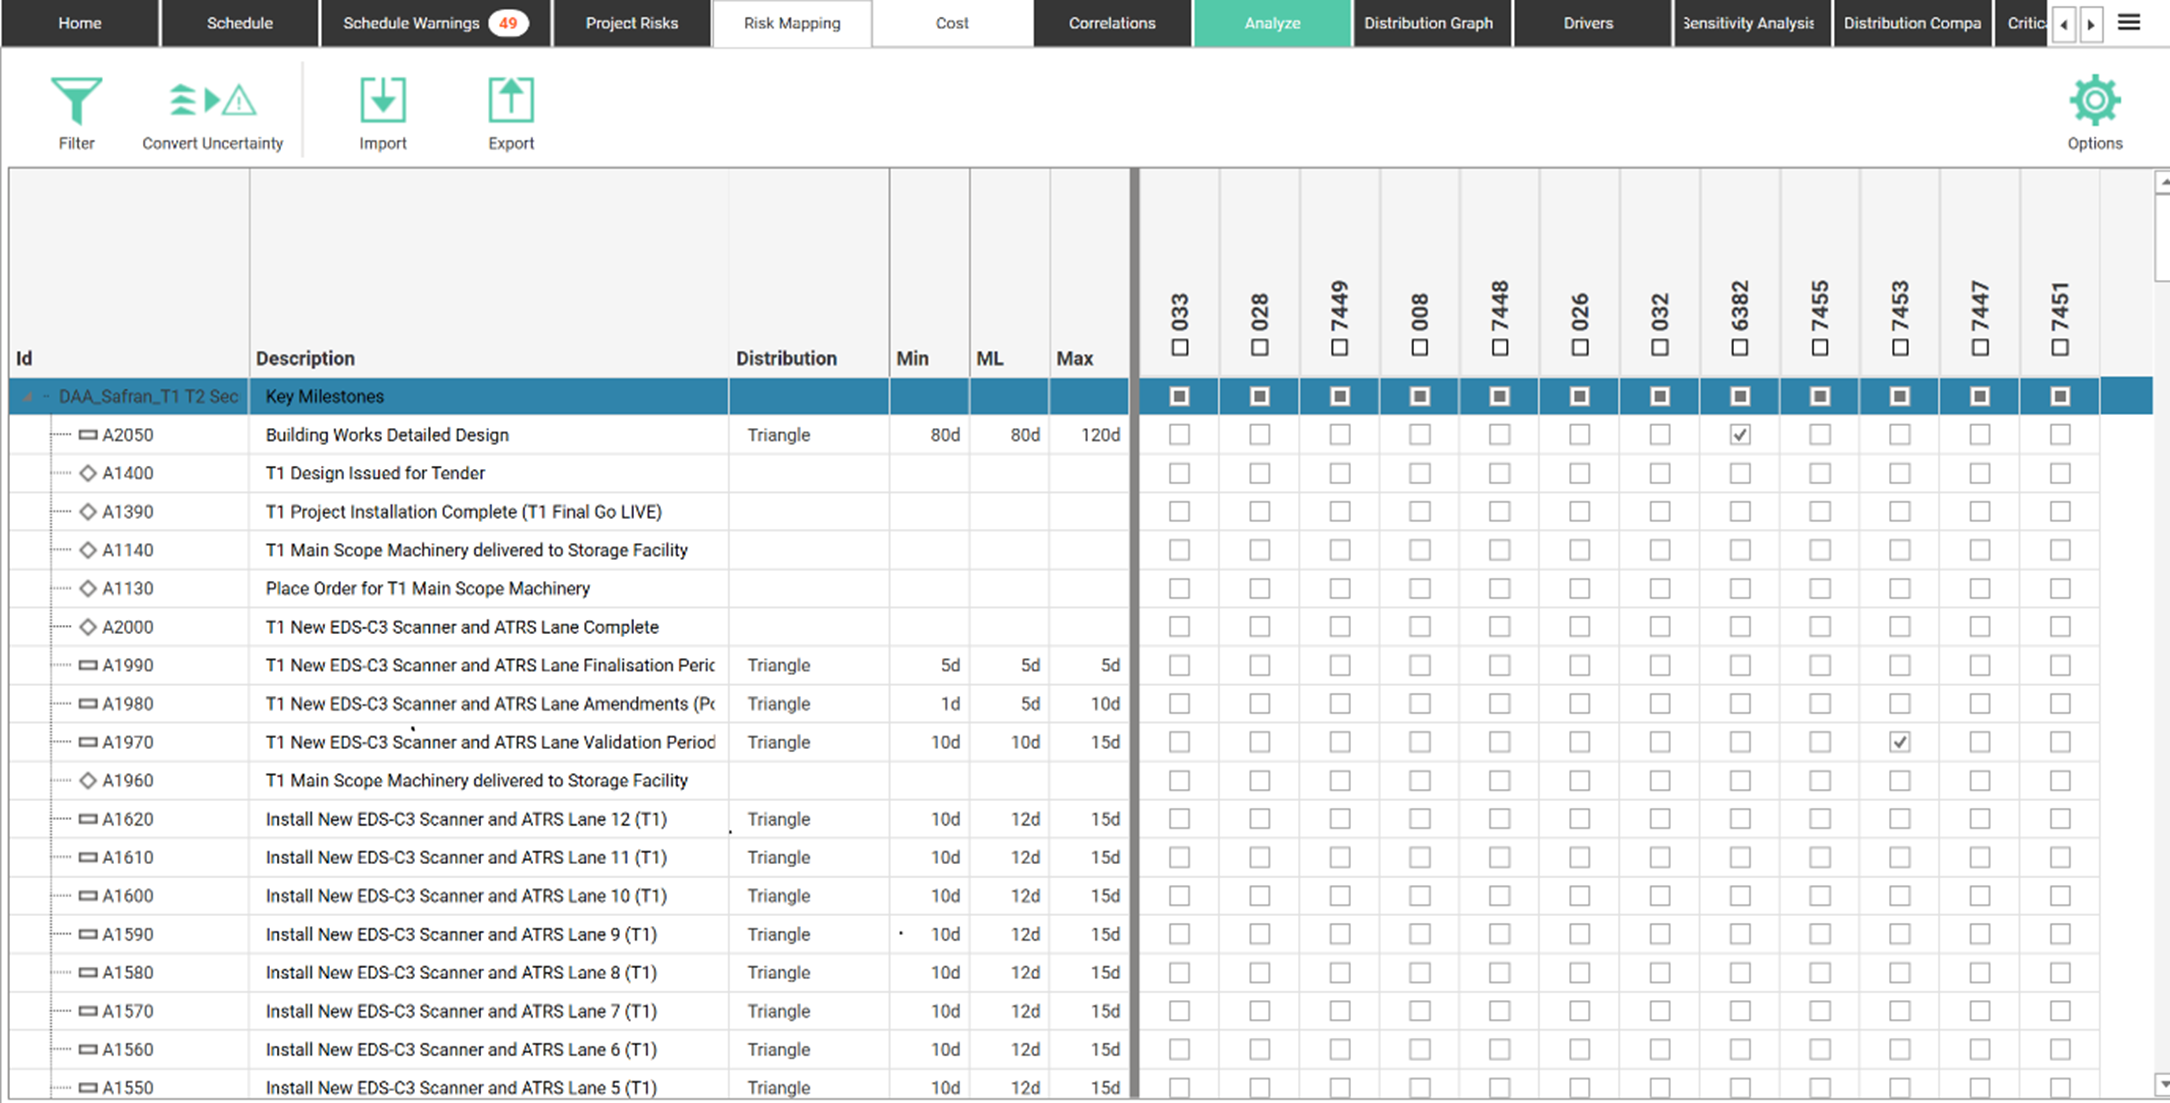
Using this detailed risk description, we can more readily complete quantitative assessment from a cost and schedule perspective (staggered shifts or night-time working), as well as be more accurate with our risk mapping (pinpointing the platform erection rather than the whole of package 6.1).
Although the modelling software is likely to only allow inclusion of the risk description, having this detailed back up gives greater confidence that the risk has been properly considered.
Beyond QRA, using a more detailed risk description approach enables more effective risk management; with clear causes we can target more effective risk responses. With clarity around the impact, we can more readily develop fallback plans and establish ways to reduce the impact.
This can be useful if your organisation or client prefers to see a target (or ‘post-mitigated’) output; you want to have a level of confidence that identified response actions are achievable, and are planned (eg, factored into the baseline budget and schedule).
The benefits of this approach in terms of the model outputs include:
- Greater confidence in the risk impacts and outputs (we know what the additional activities are and what has been priced, not a ‘finger in the air’ assessment based on someone’s judgement).
- Greater confidence in the potential to control and reduce risks (through greater understanding of root causes, ability to more easily identify ways to reduce risk impacts and develop fallback plans).
- Greater intelligence around task and risk sensitivity through more robust risk mapping.
One of the most useful outputs of risk modelling software can be the tornado charts, that show which tasks and risks are most sensitive. If your inputs are accurate, you can have more confidence in your outputs, including greater confidence in using the output tornado charts to focus management attention. An example tornado chart is shown below: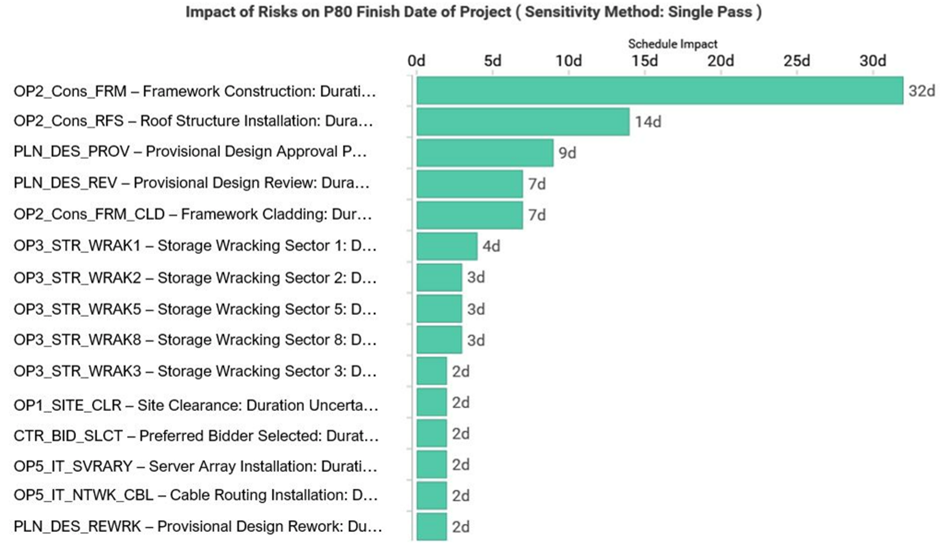
In summary
Performing QRA isn’t a quick exercise and isn’t just about the numbers (risk impacts). This article has highlighted just a few of the benefits of improving risk description in order to enhance the risk modelling process, as well as sharing a couple of tips to enhance your risk recording process.
For further information on services offered, please visit our website, www.optimise-risk.co.uk , or feel free to get in touch at hello@optimise-risk.co.uk