
Correlation is often crucial to the risk model. It helps analysts understand the often-complex relationships between events and the risks that can affect them. More than that, it plays an integral role in counteracting the effects of the Central Limit Theorem (CLT).
Hello, my name is Ian Nicholson, VP of Solutions at Emerald Associates.
Oracle Primavera Risk Analysis has been a fixture of the project management and risk analysis profession for almost 30 years (if you include its previous incarnation as Pertmaster).
For much of that time its reputation was well-earned. However, Primavera has gradually withdrawn support for the platform over the past few years, rendering it increasingly unsuitable for today’s risk managers.
This has led me, along with many others in the project controls profession, to seek a more modern and robust alternative to OPRA. And my preferred solution is Safran Risk (SR).
Over the last few weeks, I've been outlining the main differences between OPRA and Safran Risk, and why I believe you should migrate. Today’s article, part six, takes an in-depth look at the approach to correlation and the Central Limit Theorem on the respective platforms.

The Role of Correlation in Risk Analysis
Put simply, in the realm of schedule risk analysis, correlation describes the mutual relationship between one or more events. It indicates the increase or decrease in probability of a particular risk event occurring should a related risk strike.
Think of it this way: if the first piling activity on an earthworks project suffers issues, correlation allows you to gauge the probable impact this will have on subsequent piling activities. Further, it helps you estimate the likelihood that excavation activities as a whole will be affected.
When viewed from that perspective, it’s easy to see why risk managers build correlation into their risk models. But of correlation has another purpose: to counteract the effects of the Central Limit Theorem.
Correlation and the Central Limit Theorem
There have been many articles written about CLT, but to summarize the main thrust of the theorem:
If you have several similar duration activities linked together in a series that possess the same uncertainties, should one randomly-sampled activity ‘go long’, another will ‘go short’ – they will effectively cancel each other out. This leads to a loss of extreme values in the probabilistic analysis.
That being the case, some argue that correlation is crucial when it comes to combatting the Central Limit Theorem and its impact on the model. While others claim that, so long as you operate on a high-level schedule, the CLT is a non-issue and thus correlation is not required.
We’ll leave the discussion of which level of schedule risk should be performed and when for another blog, but personally, I prefer working with the project team’s live schedule. These tend to clock in at level three or four, which makes correlation a vital component of the wider model.
Let’s take a look at the impact of the CLT on a one and ten activity schedule.
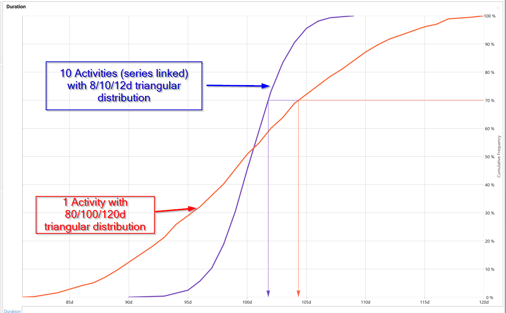
Figure 1: The effect of Central Limit Theorem on a ‘one and ten activity schedule’ with the same overall deterministic duration and uncertainty distribution. P0 duration is 80 days vs 90 days; P100 duration is 120 days vs 110 days.
As you can see, the CLT has cut ten days off each end of the distribution in the case of the ten-activity model. However, applying correlation can correct the impact of the CLT by preventing the cancellation that occurs in a purely random sampling.
Applying an 80% correlation between the risks leads to the following result:
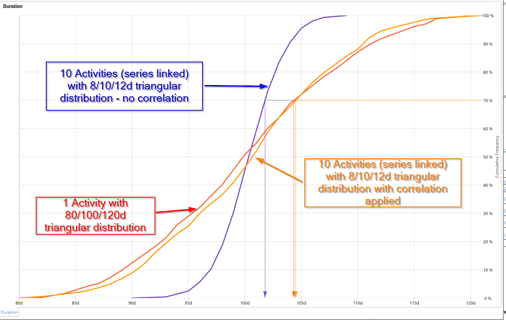
Figure 2: The effects of applying correlation to correct the Central Limit Theorem in our one and ten activity schedules.
By applying a correlation to the uncertainties on the ten-activity model specifically, we can closely approximate the one activity model. So, to reflect the risk’s interdependencies and combat the CLT on our model, we need to enter correlation.
But how do OPRA and Safran Risk compare when it comes to correlating risk?
OPRA vs. Safran Risk
In OPRA, correlation is assigned between activities. This means that to combat the central limit theorem for ten activities, you need to link each of them together in the tool’s correlation module. While this isn’t a particularly complex process, it can be time-consuming – and it only gets worse as additional activities are correlated.
What’s particularly confusing for the user is that they have to decide which activity is the ‘parent’ and which the ‘children’ in the correlation. Which activity takes precedence. Do you choose the first one in the string? The longest? Or something else? But because OPRA documents activities so poorly, it can be difficult to decide which makes the most sense.
Performing multiple correlations between activities, along with several uncertainties or risks, only adds to the complexity. Unless you have a PhD in statistics, chances are you won’t know what to correlate or by how much.
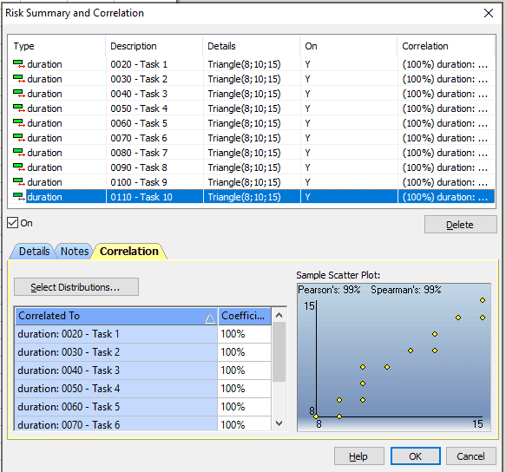
Figure 3: Correlation Assignment in OPRA
Safran Risk takes a different approach…
A Modern Approach to Correlation
First and foremost, Safran Risk correlates the risks themselves, not the activities. This makes perfect sense in that, if you have an activity with multiple risks, the correlation applies exclusively to the risk in question and not the entire activity. Similarly, if a risk affects multiple activities, the correlation is applied automatically (although this can be turned off manually, if required).
The biggest advantage Safran Risk has over OPRA is that it offers several ways to handle correlation.
The first, single risk impact correlation, correlates the impact of a single risk on every activity to which it applies. As you can see in the diagram below, unchecking the box will apply 100% correlation to each activity the risk is assigned to:
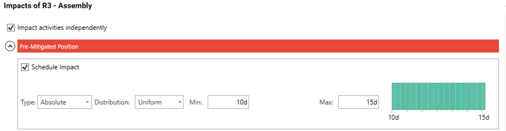
Figure 4: Safran single risk impact correlation
What if you need to correlate multiple risks? OPRA’s approach to activity correlation makes this almost impossible. By contrast, Safran Risk allows you to correlate risks simultaneously, automatically calculating the appropriate impacts. This is demonstrated in the Safran Risk correlation mapping matrix below:
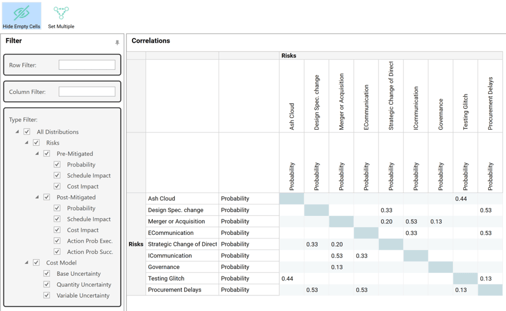
Figure 5: Safran Risk Correlation Mapping Matrix
Aside from giving you the tools to correlate risks to each other, it enables you to independently correlate the probability of each individual risk’s occurrence and its potential impact on the schedule. Further, the pre and post-mitigated positions can be differently correlated, along with cost risks (not shown above).
All things considered, understanding and applying correlation in Safran Risk is considerably easier.
Why You Should Incorporate Correlation into Your Risk Model
As we’ve discovered over the course of this article, when incorporated into your risk model, correlation leads to better, more accurate results (not to mention less discussion of the Central Limit Theorem!) And, when correlation is clear and easy, you're more likely to apply it.
Check back in a few days’ time for part 7 in my series. Be sure to read my existing articles if you’re interested in learning more about the differences between OPRA and Safran Risk in the meantime.
This is Part 6 of a series of articles by Ian Nicholson, you can find Part 7 here: Why Upgrade from Oracle Primavera Risk Analysis to Safran Risk – Mitigation Analysis